Use Metrics to Evaluate Your Model#
In this part of our end-to-end series, we will evaluate the annotation results of our dataset using the metrics module. To see the previous steps, you can refer to the tutorials such as creating the dataset, adding responses and suggestions or training your model. Feel free to check out the practical guides page for more in-depth information.
After having your dataset annotated by the annotators, it is strongly recommended to evaluate the annotation results. Within the metrics module, we divide the evaluation metrics into three: Agreement Metrics, Suggestions Metrics, and Responses Metrics. Agreement Metrics are the metrics that you can employ to evaluate the agreement between the annotators. Generally referred to as “Inter-Annotator Agreement” in the literature, this metric has various implementations developed by different
researchers, some notable examples of which are Krippendorff’s Alpha, Cohen’s Kappa, Fleiss’ Kappa, Scott’s Pi, and Bennet, Albert and Goldstein’s S. With these metrics, you can see how reliable the annotations are and how much the annotators agree with each other.
On the other hand, Suggestions Metrics are the metrics that you can employ to evaluate the responses of the annotators against the suggestions given to them. This will demonstrate how good the responses of each annotator are compared to a gold standard. In addition, we have the opportunity to unify the responses given by different annotators for a single record. This way, either the unified responses or responses can be evaluated. In a similar way, Responses Metrics are the metrics that you can employ to evaluate the suggestions given to the annotators against the responses given by them. This will give us an insight into how good the suggestions are, whether they are helpful or not, and whether the model needs to be improved.
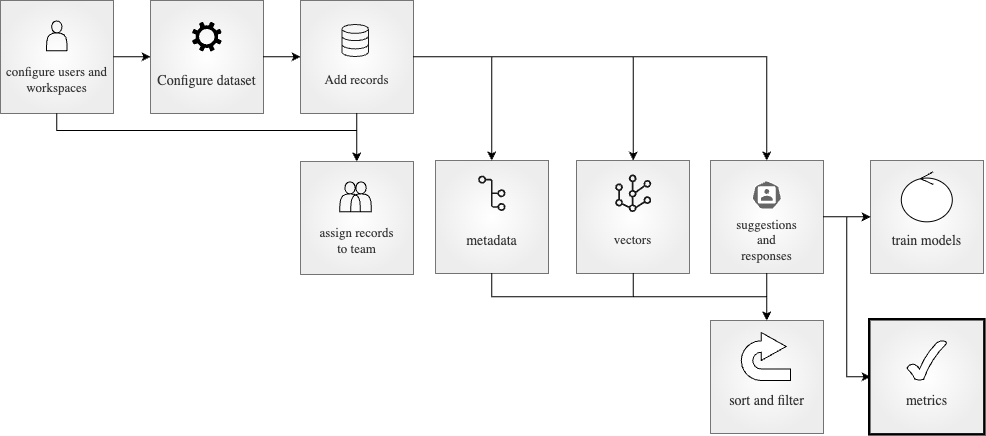
Table of Contents#
Running Argilla#
For this tutorial, you will need to have an Argilla server running. There are two main options for deploying and running Argilla:
Deploy Argilla on Hugging Face Spaces: If you want to run tutorials with external notebooks (e.g., Google Colab) and you have an account on Hugging Face, you can deploy Argilla on Spaces with a few clicks:

For details about configuring your deployment, check the official Hugging Face Hub guide.
Launch Argilla using Argilla’s quickstart Docker image: This is the recommended option if you want Argilla running on your local machine. Note that this option will only let you run the tutorial locally and not with an external notebook service.
For more information on deployment options, please check the Deployment section of the documentation.
Tip
This tutorial is a Jupyter Notebook. There are two options to run it:
Use the Open in Colab button at the top of this page. This option allows you to run the notebook directly on Google Colab. Don’t forget to change the runtime type to GPU for faster model training and inference.
Download the .ipynb file by clicking on the View source link at the top of the page. This option allows you to download the notebook and run it on your local machine or on a Jupyter notebook tool of your choice.
First, let’s install our dependencies and import the necessary libraries:
[ ]:
!pip install argilla
!pip install datasets transformers
[13]:
import argilla as rg
from argilla._constants import DEFAULT_API_KEY
from argilla.client.feedback.metrics.annotator_metrics import ModelMetric
In order to run this notebook we will need some credentials to push and load datasets from Argilla and 🤗 Hub, let’s set them in the following cell:
[ ]:
# Argilla credentials
api_url = "http://localhost:6900"  # "https://<YOUR-HF-SPACE>.hf.space"
api_key = DEFAULT_API_KEY  # admin.apikey
# Huggingface credentials
hf_token = "hf_..."
Log in to Argilla:
[ ]:
rg.init(api_url=api_url, api_key=api_key)
Enable Telemetry#
We gain valuable insights from how you interact with our tutorials. To improve ourselves in offering you the most suitable content, using the following lines of code will help us understand that this tutorial is serving you effectively. Though this is entirely anonymous, you can choose to skip this step if you prefer. For more info, please check out the Telemetry page.
[ ]:
try:
    from argilla.utils.telemetry import tutorial_running
    tutorial_running()
except ImportError:
    print("Telemetry module is introduced in Argilla 1.20.0 and not found in the current installation. Skipping telemetry.")
Pull the Dataset#
To employ metrics, we can pull a dataset that consists of multiple annotations per record. We can do this either from HuggingFace Hub. Let us see how we can pull it.
From HuggingFace Hub#
We can also pull the dataset from HuggingFace Hub. Similarly, we can use the from_huggingface method to pull the dataset.
[ ]:
dataset = rg.FeedbackDataset.from_huggingface("argilla/go_emotions_raw", split="train[:1000]")
Note
The dataset pulled from HuggingFace Hub is an instance of FeedbackDataset whereas the dataset pulled from Argilla is an instance of RemoteFeedbackDataset. The difference between the two is that the former is a local one and the changes made on it stay locally. On the other hand, the latter is a remote one and the changes made on it are directly reflected on the dataset on the Argilla server, which can make your process faster.
Let us briefly examine what our dataset looks like. It is a dataset that consists of data items with the field text. For each record, we have multiple annotations that label the text with at least one sentiment. Let us see an example of a text and the given responses. In this example, the record has been annotated by 3 annotators and one of them has labeled the text with one sentiment while the other two have labeled it with two sentiments.
[140]:
print("text:", dataset[5].fields["text"])
print("responses:", [dataset[5].responses[i].values["label"].value for i in range(len(dataset[5].responses))])
text:  And not all children's hospitals need the same stuff, so call and ask what they need. But I like your tip. You're correct.
responses: [['neutral'], ['approval', 'desire'], ['approval', 'love']]
From Argilla#
We can pull the dataset from Argilla by using the from_argilla method.
Unify Responses#
When you have multiple annotations per record in your project, it is a good practice to unify the responses to have a single response per record. This is preferable as it makes the dataset more consistent and easier to work with. Let us see how we can unify the responses with Argilla. First, we create a strategy to unify the responses. We go with the majority vote strategy, which means that we will keep the responses that have been suggested by the majority of the annotators.
[146]:
strategy = rg.MultiLabelQuestionStrategy("majority")
[ ]:
dataset.compute_unified_responses(
    question=dataset.question_by_name("label"),
    strategy=strategy,
)
We can look at a record to see how the responses have been unified. In our case, the responses have been unified to approval as it is the majority vote among the responses.
[148]:
dataset.records[5].unified_responses
[148]:
{'label': [UnifiedValueSchema(value=['approval'], strategy=<RatingQuestionStrategy.MAJORITY: 'majority'>)]}
Annotation Metrics#
Argilla offers various annotation metrics to evaluate the performance of the annotators. Let us see how we can employ each one of them.
Agreement Metrics#
The first step for the evaluation is to contrast the responses given by the annotators with each other, which is commonly known as Inter-Annotator Agreement. This is a crucial step to see how reliable the annotations are and how much the annotators agree with each other. Argilla currently offers only Krippendorff’s alpha as an agreement metric. Let us see how we can evaluate the agreement between the annotators with Argilla.
To calculate the alpha, we only need to call the compute_agreement_metrics method, with alpha being the argument. We also need to specify the question name in our dataset to calculate the metric. Please note that agreement metrics are available for all question types except for the TextQuestion.
[3]:
dataset.compute_agreement_metrics("alpha", question_name="label")
[3]:
AgreementMetricResult(metric_name='alpha', count=3468, result=0.2459926458269277)
The result we have shows that the agreement between the annotators is 0.2459 for the dataset we have, which is a low agreement. For Kripendorff’s alpha, the value is in the range [0,1] and is usually interpreted in the following way: alpha >= 0.8 indicates a reliable annotation, alpha >= 0.667 allows making tentative conclusions, while the lower values suggest the unreliable annotation. This indicates we might want to revisit our annotation process and work on a better task design or annotator training.
Model Metrics#
For computing model metrics, we will assume that the responses given by the annotators are the gold standard, we compare against. The main advantage of adding suggestions to our dataset is to simplify and shorten the annotation task. By computing the model metrics, we will be able to see if the suggestions work in the way we want and if our models running inference are on apr with our expectations. In case of a low performance, we can consider improving the suggestions by updating and fine-tuning the model to generate better suggestions. This way, we can improve the performance of the annotators as well.
The question type we have in the current dataset is MultiLabelQuestion. By using the allowed_metrics method, we can see the metrics below, which are the available ones for this question type.
[ ]:
metric = ModelMetric(dataset=dataset, question_name="label")
metric.allowed_metrics
['accuracy', 'f1-score', 'precision', 'recall', 'confusion-matrix']
With Argilla, we can calculate the responses metrics easily with the compute_responses_metrics method. In this example, we will calculate all allowed metrics for the MultiLabelQuestion question type.
[ ]:
model_metrics = dataset.compute_model_metrics(question_name="label", metric_names=metric.allowed_metrics)
[16]:
model_metrics["00000000-0000-0000-0000-000000000004"]
[16]:
[ModelMetricResult(metric_name='accuracy', count=182, result=0.5714285714285714),
 ModelMetricResult(metric_name='f1-score', count=182, result=0.428750352375672),
 ModelMetricResult(metric_name='precision', count=182, result=0.4427905213343358),
 ModelMetricResult(metric_name='recall', count=182, result=0.5377066798941799),
 ModelMetricResult(metric_name='confusion-matrix', count=182, result={'admiration':                             suggestions_admiration_true  \
 responses_admiration_true                           174
 responses_admiration_false                            0

                             suggestions_admiration_false
 responses_admiration_true                              5
 responses_admiration_false                             3  , 'amusement':                            suggestions_amusement_true  \
 responses_amusement_true                          176
 responses_amusement_false                           1

                            suggestions_amusement_false
 responses_amusement_true                             3
 responses_amusement_false                            2  })]
Model Metrics for Unified Responses#
We have calculated the given metrics for each comparing the model performance against each annotator individually and obtained the respective results for the metric. However, we may sometimes want to calculate the performance of the model against annotators collectively, where we compare the suggestions against unified responses of annotators . As stated above, Argilla offers us the opportunity to unify the responses of annotators according to different strategies. We can first unify the responses as shown and then calculate the metrics for the unified responses.
To accomplish this, we only need to feed the method above with the strategy argument. When this argument is set with the preferred strategy, the responses will first be unified and then, these unified responses will be compared to the suggestions. Let us go with the majority strategy.
[ ]:
model_metrics_unified = dataset.compute_model_metrics(question_name="label", metric_names=["accuracy", "precision", "recall", "f1-score"], strategy="majority")
[20]:
model_metrics_unified
[20]:
[ModelMetricResult(metric_name='accuracy', count=1000, result=0.812),
 ModelMetricResult(metric_name='precision', count=1000, result=0.7693494302078528),
 ModelMetricResult(metric_name='recall', count=1000, result=0.7744636775213872),
 ModelMetricResult(metric_name='f1-score', count=1000, result=0.7578965673231839)]
Conclusion#
In this tutorial, we have seen how we can evaluate the annotation results of our dataset using the metrics module. We have first unified the response to have a more comprehensive outlook on the annotations. Then, we have calculated the agreement metrics to see how much our annotators agree with each other. After that, we have calculated the suggestions metrics to see how good the responses of each annotator are compared to a gold standard, which is the suggestions in this case. Similarly, we
have calculated the responses metrics to see how good the suggestions are compared to the responses of the annotators.
For both suggestions and responses metrics, we have calculated the metrics per annotator and for the unified responses. If you feel that the annotations are not satisfactory, you can reiterate the annotation process by making changes in the structure of your project. You can refer to the practical guides to refine your structure or check out the advanced tutorials to learn more about the advanced use cases of Argilla.