📊 Collect responses and metrics#
Feedback Dataset#
Note
The dataset class covered in this section is the FeedbackDataset. This fully configurable dataset will replace the DatasetForTextClassification, DatasetForTokenClassification, and DatasetForText2Text in Argilla 2.0. Not sure which dataset to use? Check out our section on choosing a dataset.
To collect the responses given by annotators via Python, you can simply load the dataset from Argilla as follows:
import argilla as rg

rg.init(
    api_url="...",
    api_key="...",
)

feedback = rg.FeedbackDataset.from_argilla("demo_feedback", workspace="recognai")
Each record in feedback.records will have an attribute responses where you will find a list with all the responses to that record, if any. Each response will have the following attributes:
user_id: contains the Argilla user ID of the annotatorvalues: contains the responses given by the annotator in the shape of a dictionary, where the key is the name of the question and the value is another dictionary where you can find the answer to the question under the keyvalue.status: contains the status of the response i.e., whether it issubmitted, ordiscarded.
If your dataset doesn’t have any annotation overlap i.e., all records have at most one response, the post-processing stage will be quite simple since you won’t need to decide which annotations to keep and which to discard.
Note
Remember to only take into account responses with the submitted status.
Measure disagreements#
If your dataset does have records with more than one submitted response, you will need to unify the responses before using the data for training.
Ratings often represent a subjective value, meaning that there is no wrong or right answer to these questions. However, since a RatingQuestion has a closed set of options, their results can help with visualizing the disagreement between annotators. On the other hand, texts are unique and subjective, making it almost impossible that two annotators will give the same answer for a TextQuestion. For this reason, we don’t recommend using these responses to measure disagreements.
If you want to do an initial exploration of the responses, you can use your preferred library for plotting data. Here are some simple examples of some visualizations that you could do to evaluate the potential disagreement between annotators:
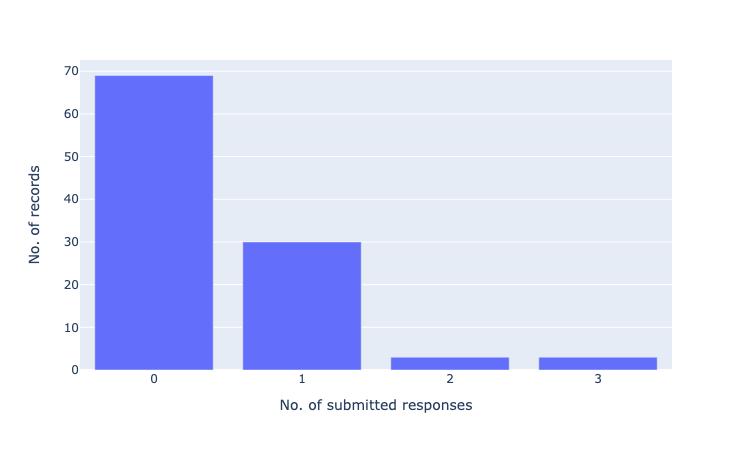
# plot 1: submitted responses per record
from collections import Counter, OrderedDict
import plotly.express as px

count_submitted = Counter()
for record in feedback.records:
    if record.responses:
        submitted = [r for r in record.responses if r.status == "submitted"]
        count_submitted[len(submitted)] += 1
count_submitted = OrderedDict(sorted(count_submitted.items()))
count_submitted = [{"submitted_responses": k, "no_records": v} for k, v in count_submitted.items()]

fig = px.bar(count_submitted, x="submitted_responses", y="no_records")
fig.update_xaxes(title_text="No. of submitted responses", dtick=1)
fig.update_yaxes(title_text="No. of records")
fig.show()
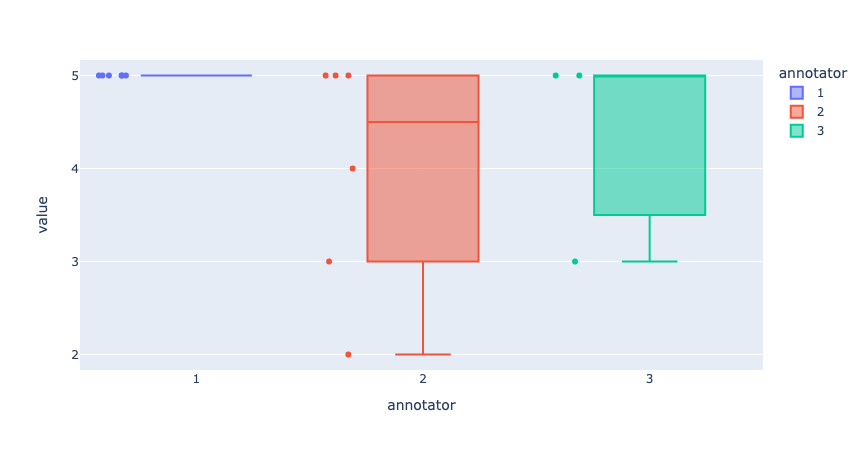
# plot 2: distance between responses in rating question
list_values = []
for record_ix,record in enumerate(feedback):
    if record.responses:
        submitted = [r for r in record.responses if r.status == "submitted"]
        if len(submitted) > 1:
            for response_ix, response in enumerate(submitted):
                list_values.append({"record": str(record_ix+1), "annotator": str(response_ix+1), "value": response.values["rating"].value})


fig = px.box(list_values, x="annotator", y="value", color="annotator", points="all", hover_data="record")
fig.update_yaxes(dtick=1)
fig.show()
Hint
If you feel that the disagreement between annotators is too high, especially for questions that aren’t as subjective, this is a good sign that you should review your annotation guidelines and/or the questions and options.
Unifying Disagreements#
In this section, we explore some techniques you can use to solve disagreements in the responses. These are not the only possible techniques and you should choose them carefully according to the needs of your project and annotation team. Even though there are many ways in which you can unify responses, we offer support for some of them out-of-the-box.
Code#
You can unify responses by using a FeedbackDataset in combination with a QuestionStrategy.
from argilla import LabelQuestionStrategy, FeedbackDataset

dataset = FeedbackDataset.from_huggingface(
    repo_id="argilla/stackoverflow_feedback_demo"
)
strategy = LabelQuestionStrategy("majority") # "disagreement", "majority_weighted (WIP)"
dataset.compute_unified_responses(
    question=dataset.question_by_name("title_question_fit"),
    strategy=strategy,
)
dataset.records[0].unified_responses
from argilla import MultiLabelQuestionStrategy, FeedbackDataset

dataset = FeedbackDataset.from_huggingface(
    repo_id="argilla/stackoverflow_feedback_demo"
)
strategy = MultiLabelQuestionStrategy("majority") # "disagreement", "majority_weighted (WIP)"
dataset.compute_unified_responses(
    question=dataset.question_by_name("tags"),
    strategy=strategy,
)
dataset.records[0].unified_responses
from argilla import RankingQuestionStrategy, FeedbackDataset

dataset = FeedbackDataset.from_huggingface(
    repo_id="argilla/stackoverflow_feedback_demo"
)
strategy = RankingQuestionStrategy("majority") # "mean", "max", "min"
dataset.compute_unified_responses(
    question=dataset.question_by_name("relevance_ranking"),
    strategy=strategy,
)
dataset.records[0].unified_responses
from argilla import RatingQuestionStrategy, FeedbackDataset

dataset = FeedbackDataset.from_huggingface(
    repo_id="argilla/stackoverflow_feedback_demo"
)
strategy = RatingQuestionStrategy("majority") # "mean", "max", "min"
dataset.compute_unified_responses(
    question=dataset.question_by_name("answer_quality"),
    strategy=strategy,
)
dataset.records[0].unified_responses
Note
You can also pass the question and strategy as string directly.
Warning
Starting from Argilla 1.21.0, unify_responses is deprecated. Please use compute_unified_responses instead.
Once you have unified your responses, you will have a dataset that’s ready for fine-tuning. Remember to save your unified dataset following one of the methods explained in Export a Feedback Dataset.
Strategies#
For labels: LabelQuestion and MultiLabelQuestion#
Majority vote (single-label questions): Labels can be aggregated using the most popular option, for which you will need to have at least 3 submitted responses. In the case of a tie, you can break it by choosing a random option.
Majority vote (multi-label questions): If you are aggregating labels from a multi-label question, it would be more correct to calculate the majority vote per label. That means that for each label you need to check whether the majority of the annotators selected that specific label or not.
Weighted majority vote: You may decide to give some of your annotators more weight than others when aggregating labels so that their decisions count more than others. Some reasons to consider a weighted majority might be: because some annotators tend to have better agreement with ground truth annotations, they are experts or they represent the demographic target for specific questions. If you want to choose this option, first calculate a score from 0 to 1 for each annotator, then apply these weights to their responses. Finally, sum all the values and choose the option with the highest score.
Train with disagreements: If your labels are meant to solve highly subjective tasks, like sentiment analysis or abusive language detection, you may want to consider other options that preserve the natural disagreement between annotators during training. This is especially helpful to avoid diluting the feedback of minorities within your annotation team. If you want to learn more about this approach, we recommend checking the different methods discussed in Davani et al. (2021).
For numerical values: RankingQuestion and RatingQuestion#
Majority vote: If a record has more than 2 submitted responses, you can take the most popular value (for
RankingQuestions the most popular rank, forRatingQuestions the most popular rating) as the final score. In the case of a tie, you can break it by choosing a random option or the lowest / highest score.Weighted majority vote: As explained above, you may want to weigh the responses of different annotators. In that case, calculate a score from 0 to 1 for each annotator, then apply these weights to their responses. Finally, sum all the values and choose the option with the highest score.
Mean score: For this technique, you can take all responses and calculate the mean score.
Lowest / highest score: Depending on how the question is formulated, you can take the
maxorminvalue.
For texts: TextQuestion#
Rate / rank the responses: Make a new dataset that includes the texts you have collected in the record fields and ask your annotation team to rate or rank the responses. Then choose the response with the highest score. If there is a tie, choose one of the options randomly or consider duplicating the record as explained below.
Choose based on the annotator: Take a subset of the records (enough to get a good representation of responses from each annotator), and rate / rank them as explained in the section above. Then, give each annotator a score based on the preferences of the team. You can use this score to choose text responses over the whole dataset.
Choose based on answers to other questions: You can use the answers to other questions as quality markers. For example, you can assume that whoever gave the lowest score will make a more extensive correction and you may want to choose that as the final text. However, this method does not guarantee that the text will be of good quality.
Duplicate the record: You may consider that the different answers given by your annotation team are all valid options. In this case, you can duplicate the record to keep each answer. Again, this method does not guarantee the quality of the text, so it is recommended to check the quality of the text, for example using a rating question.
Annotation Metrics#
There are multiple ways to analyze the annotations on a dataset. In this section, we present three different approaches, which will enable us to analyze the agreement between annotators, analyze the quality of responses against suggestions as ground truths, and analyze the quality of the suggestions against the responses as ground truths.
Note
The following metrics only apply to the FeedbackDataset.
Agreement Metrics#
After the annotation process, the annotation data should be evaluated to see the quality of the results obtained. The first step for evaluation would be the calculation of the agreement between the annotators. Inter-Annotator Agreement (IAA), as it is commonly known in the literature, is a way to explore the performance of many parameters such as the quality of the annotation guidelines, whether there is uniformity in the annotation process and whether the annotators are consistent in their annotations.
import argilla as rg
from argilla.client.feedback.metrics import AgreementMetric

feedback_dataset = rg.FeedbackDataset.from_argilla("...", workspace="...")
metric = AgreementMetric(dataset=feedback_dataset, question_name="question_name")
agreement_metrics = metric.compute("alpha")
# >>> agreement_metrics
# [AgreementMetricResult(metric_name='alpha', count=1000, result=0.467889)]
With the compute function, we have obtained a container that stores the metric name and the value of the metric as well as the number of records that were used to calculate the metric.
The metrics can also be computed easily from a FeedbackDataset:
import argilla as rg

#dataset = rg.FeedbackDataset.from_huggingface("argilla/go_emotions_raw")

agreement_metrics = dataset.compute_agreement_metrics(question_name="label", metric_names="alpha")
agreement_metrics

# AgreementMetricResult(metric_name='alpha', count=191792, result=0.2703263452657748)
Currently, the only agreement metric supported is Krippendorf’s alpha, for all question types except for the TextQuestion. This metric can be computed for any number of annotators, even if some of the responses are not submitted. The value from this measure is in the range [0,1] and is usually interpreted in the following way: alpha >= 0.8 indicates a reliable annotation, alpha >= 0.667 allows making tentative conclusions, while the lower values suggest unreliable annotation.
Note
In case you want to dig deeper into the measurement of the agreement between different annotators, take a look at Implementations of inter-annotator agreement coefficients surveyed by Artstein and Poesio (2007), Inter-Coder Agreement for Computational Linguistics.
Supported Agreement Metrics#
We plan on adding more support for other metrics so feel free to reach out on our Slack or GitHub to help us prioritize each task.
Question type/Metric |
alpha |
|---|---|
LabelQuestion |
✔️ |
MultiLabelQuestion |
✔️ |
RatingQuestion |
✔️ |
RankingQuestion |
✔️ |
TextQuestion |
Model Metrics#
In contrast to agreement metrics, where we compare the responses of annotators with each other, it is a good practice to evaluate the suggestions of models against the annotators as ground truths. As FeedbackDataset already offers the possibility to add suggestions to the responses, we can compare these initial predictions against the verified reponses. This will give us two important insights: how reliable the responses of a given annotator are, and how good the suggestions we are giving to the annotators are. This way, we can take action to improve the quality of the responses by making changes to the guidelines or the structure, and the suggestions given to the annotators by changing or updating the model we use. Note that each question type has a different set of metrics available.
Here is an example use of the compute function to calculate the metrics for a FeedbackDataset:
import argilla as rg
from argilla.client.feedback.metrics import ModelMetric

feedback_dataset = rg.FeedbackDataset.from_argilla("...", workspace="...")
metric = ModelMetric(dataset=feedback_dataset, question_name="question_name")
annotator_metrics = metric.compute("accuracy")
# >>> annotator_metrics
# {'00000000-0000-0000-0000-000000000001': [ModelMetricResult(metric_name='accuracy', count=3, result=0.5)], '00000000-0000-0000-0000-000000000002': [ModelMetricResult(metric_name='accuracy', count=3, result=0.25)], '00000000-0000-0000-0000-000000000003': [ModelMetricResult(metric_name='accuracy', count=3, result=0.5)]}
We obtain a dict where the keys contain the user_id of a given annotator and a list with the metrics requested. For the interpretation of these metrics, we assume here that the predictions correspond to the suggestions given to an annotator and the true labels correspond to the responses given by an annotator. This way, we can interpret the metrics and see whether the model is performing as expected. The metrics are calculated for each annotator individually, so we can see which annotators are giving responses that align with the model and which are not.
Alternatively, we have the opportunity to compute the metrics directly from the dataset. Let’s use the following dataset for this, and compute the metrics for the suggestions:
mmodel_metrics = dataset.compute_model_metrics(question_name="label", metric_names=["accuracy", "precision", "recall", "f1-score"])
suggestions_metrics['00000000-0000-0000-0000-000000000001']
# [ModelMetricResult(metric_name='accuracy', count=1269, result=0.43341213553979513),
#  ModelMetricResult(metric_name='precision', count=1269, result=0.5593881715337764),
#  ModelMetricResult(metric_name='recall', count=1269, result=0.6166023130799764),
#  ModelMetricResult(metric_name='f1-score', count=1269, result=0.5448304082545485)]
Keep in mind this dataset is quite big, so it may take some time both to download and compute the metrics. You can check the dataset for more info.
For Unified Responses#
As we have seen ModelMetric allows us to compare the suggestions from models against responses from annotators, which we choose to be the ground truths. The calculation is done separately for each of the responses, which allows us to see the performance of the model against each annotator. However, in some cases, we may want to see the performance of the model against annotators as a whole and not individually. For this, we can use the UnifiedModelMetric class, which allows us to calculate the metrics for the unified responses. For this we rely on the unification strategies, defined in the Unifying Disagreements.
import argilla as rg
from argilla.client.feedback.metrics import UnifiedModelMetric

feedback_dataset = rg.FeedbackDataset.from_argilla("...", workspace="...")
strategy_name = "majority"
unified_dataset = feedback_dataset.compute_unified_responses(question, strategy_name)
metric = UnifiedModelMetric(dataset=unified_dataset, question_name="question_name")
unified_metrics = metric.compute("accuracy")
# >>> unified_metrics
# ModelMetricResult(metric_name='accuracy', count=3, result=0.25)
We obtain the same container for the metrics result, but in this case, it’s not associated with any specific annotator but their general alignment.
We can make use of the same methods we saw above directly from the FeedbackDataset, but note the use of the strategy argument used here:
model_metrics_unified = dataset.compute_model_metrics(question_name="label", metric_names=["accuracy", "precision", "recall", "f1-score"], strategy="majority")
model_metrics_unified
# [ModelMetricResult(metric_name='accuracy', count=53990, result=0.8048342285608446),
#  ModelMetricResult(metric_name='precision', count=53990, result=0.8085185809086417),
#  ModelMetricResult(metric_name='recall', count=53990, result=0.7679974812646655),
#  ModelMetricResult(metric_name='f1-score', count=53990, result=0.786466989240015)]
By default, the responses will not be unified and we will have the responses at the annotator level, but if we ask for a specific strategy (see the strategies available for each question), they will be unified automatically and computed.
Supported Model Metrics#
We plan on adding more support for other metrics so feel free to reach out on our Slack or GitHub to help us prioritize each task.
Metric/Question type |
LabelQuestion |
MultiLabelQuestion |
RatingQuestion |
RankingQuestion |
TextQuestion |
|---|---|---|---|---|---|
accuracy |
✔️ |
✔️ |
✔️ |
||
precision |
✔️ |
✔️ |
✔️ |
||
recall |
✔️ |
✔️ |
✔️ |
||
f1-score |
✔️ |
✔️ |
✔️ |
||
confusion-matrix |
✔️ |
✔️ |
✔️ |
||
pearson-r |
✔️ |
||||
spearman-r |
✔️ |
||||
gleu |
✔️ |
||||
rouge |
✔️ |
||||
ndcg-score |
✔️ |
Other datasets#
Note
The records classes covered in this section correspond to three datasets: DatasetForTextClassification, DatasetForTokenClassification, and DatasetForText2Text. These will be deprecated in Argilla 2.0 and replaced by the fully configurable FeedbackDataset class. Not sure which dataset to use? Check out our section on choosing a dataset.
This guide gives you a brief introduction to Argilla Metrics. Argilla Metrics enables you to perform fine-grained analyses of your models and training datasets. Argilla Metrics are inspired by a number of seminal works such as Explainaboard.
The main goal is to make it easier to build more robust models and training data, going beyond single-number metrics (e.g., F1).
This guide gives a brief overview of currently supported metrics. For the full API documentation see the Python API reference.
All Python metrics are covered in:
from argilla import metrics
Note
This feature is experimental, you can expect some changes in the Python API. Please report any issue you encounter on Github.
Note
Verify you have already installed Jupyter Widgets in order to properly visualize the plots. See https://ipywidgets.readthedocs.io/en/latest/user_install.html
To run this guide, you need to install the following dependencies:
%pip install datasets spacy plotly -qqq
and the spacy model:
!python -m spacy download en_core_web_sm -qqq
1. NER prediction metrics#
Load dataset and model#
We’ll be using spaCy for this guide, but all the metrics we’ll see are computed for any other framework (Flair, Stanza, Hugging Face, etc.). As an example will use the WNUT17 NER dataset.
import argilla as rg
import spacy
from datasets import load_dataset

nlp = spacy.load("en_core_web_sm")
dataset = load_dataset("wnut_17", split="train")
Log records in dataset#
Let’s log spaCy predictions using the built-in rg.monitor method:
nlp = rg.monitor(nlp, dataset="spacy_sm_wnut17")

def predict(records):
    for _ in nlp.pipe([
        " ".join(record_tokens)
        for record_tokens in records["tokens"]
    ]):
        pass
    return {"predicted": [True]*len(records["tokens"])}

dataset.map(predict, batched=True, batch_size=512)
Explore pipeline metrics#
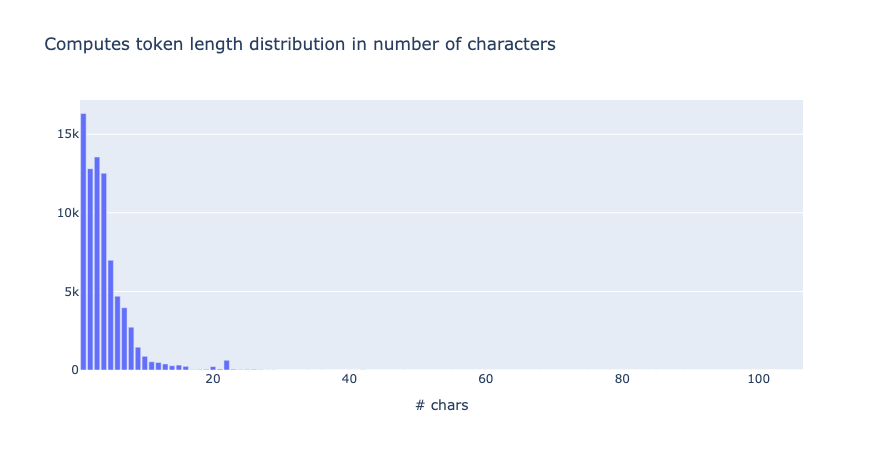
from argilla.metrics.token_classification import token_length

token_length(name="spacy_sm_wnut17").visualize()
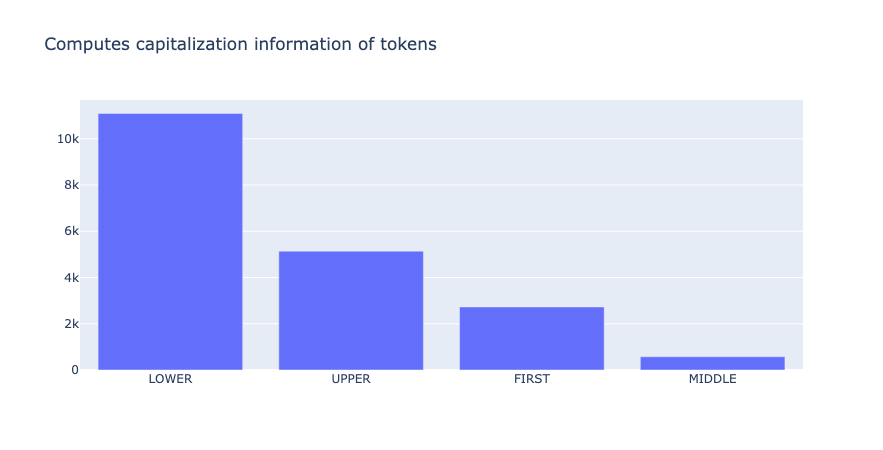
from argilla.metrics.token_classification import token_capitalness

token_capitalness(name="spacy_sm_wnut17").visualize()
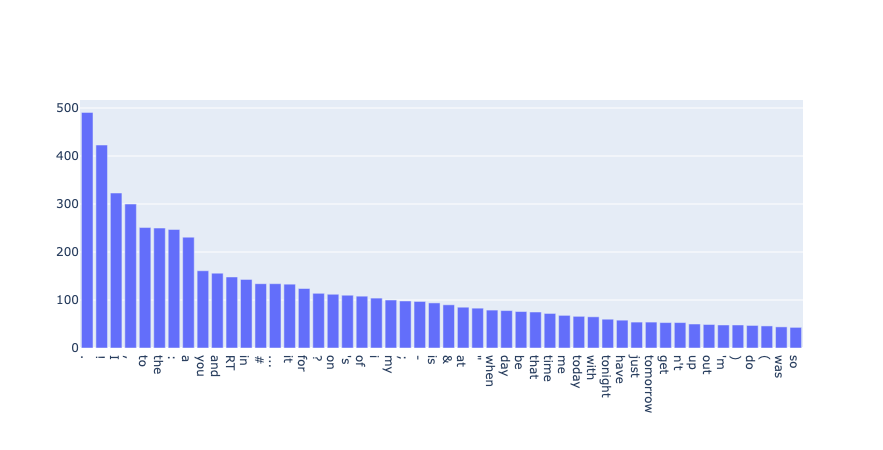
from argilla.metrics.token_classification import token_frequency

token_frequency(name="spacy_sm_wnut17", tokens=50).visualize()
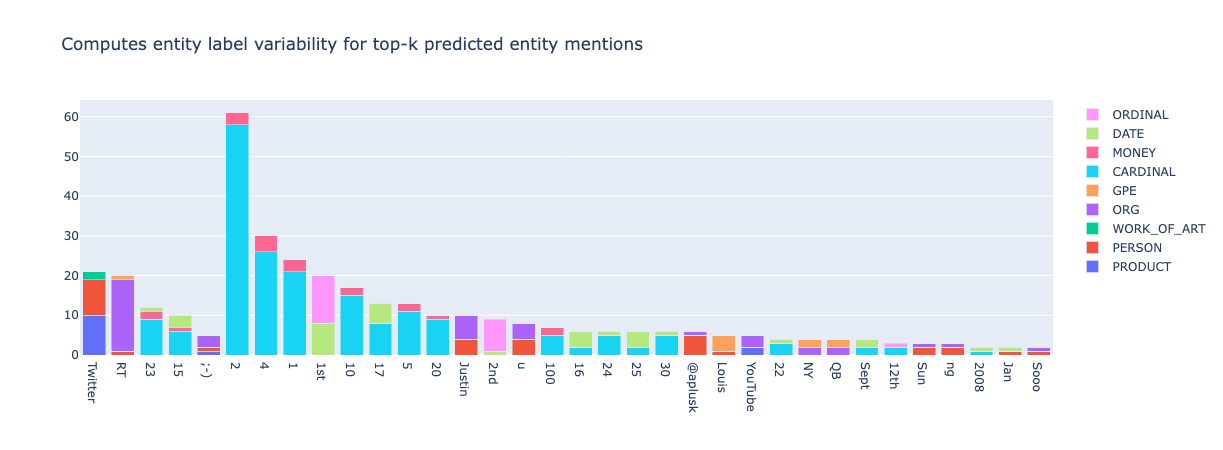
from argilla.metrics.token_classification.metrics import top_k_mentions

top_k_mentions(name="spacy_sm_wnut17", k=5000, threshold=2).visualize()
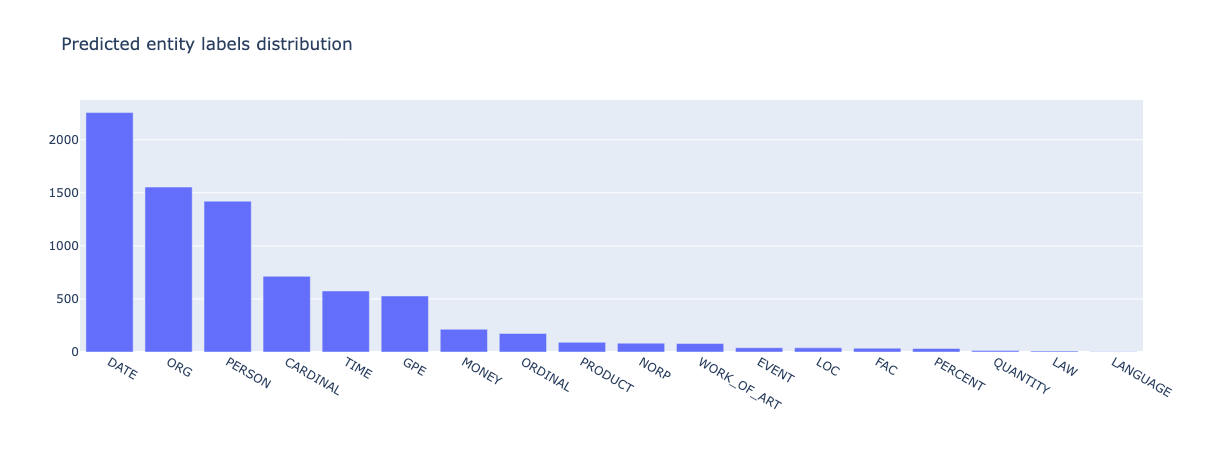
from argilla.metrics.token_classification import entity_labels

entity_labels(name="spacy_sm_wnut17").visualize()
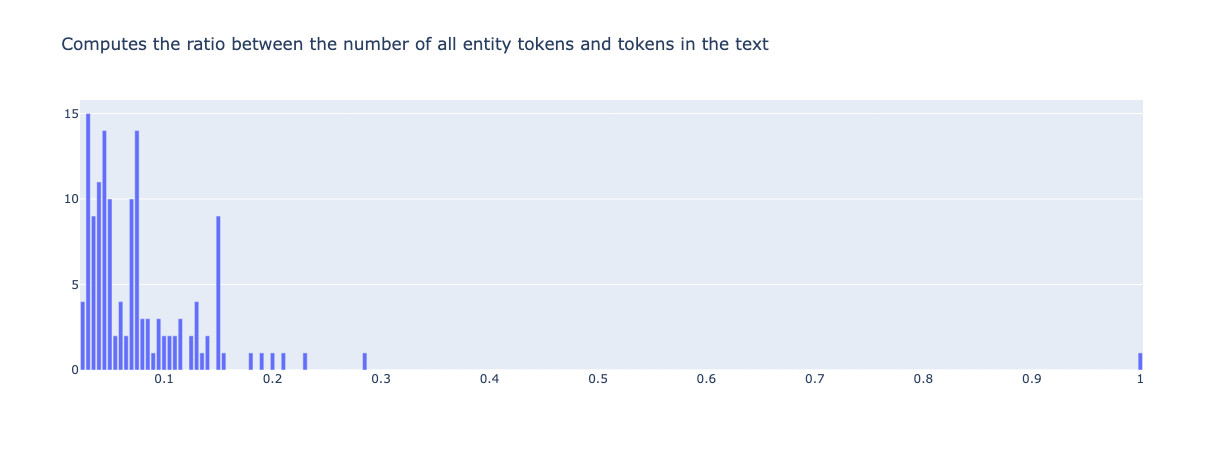
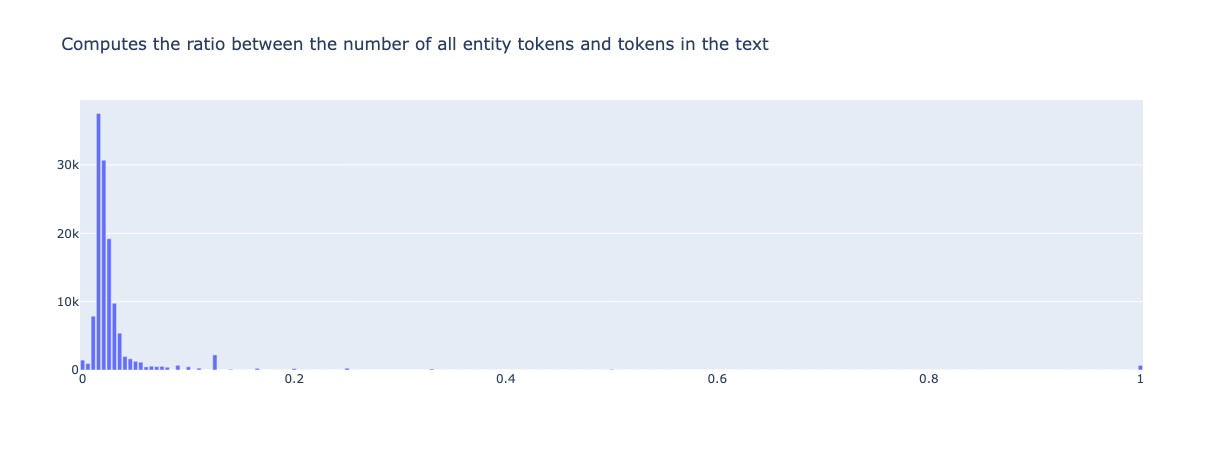
from argilla.metrics.token_classification import entity_density

entity_density(name="spacy_sm_wnut17").visualize()
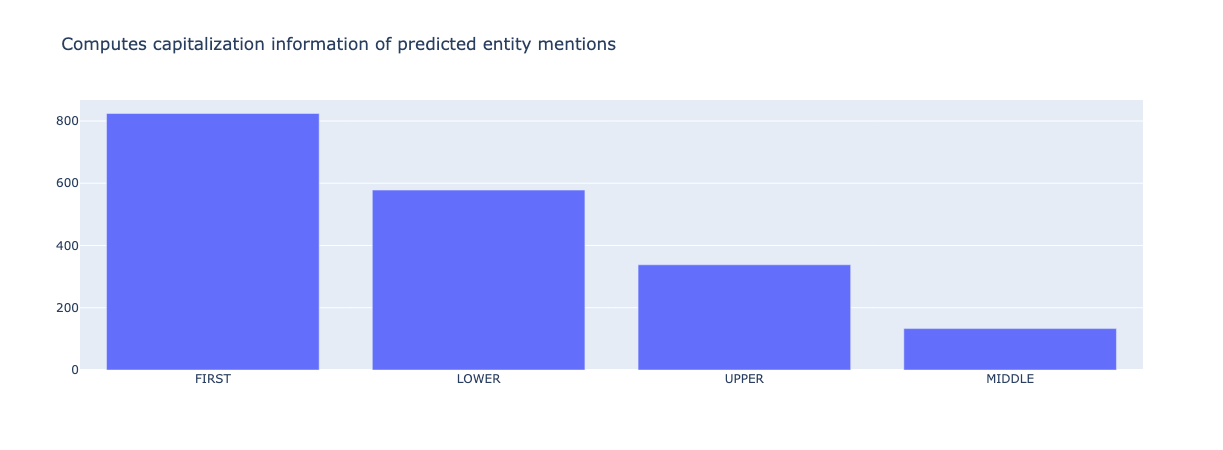
from argilla.metrics.token_classification import entity_capitalness

entity_capitalness(name="spacy_sm_wnut17").visualize()
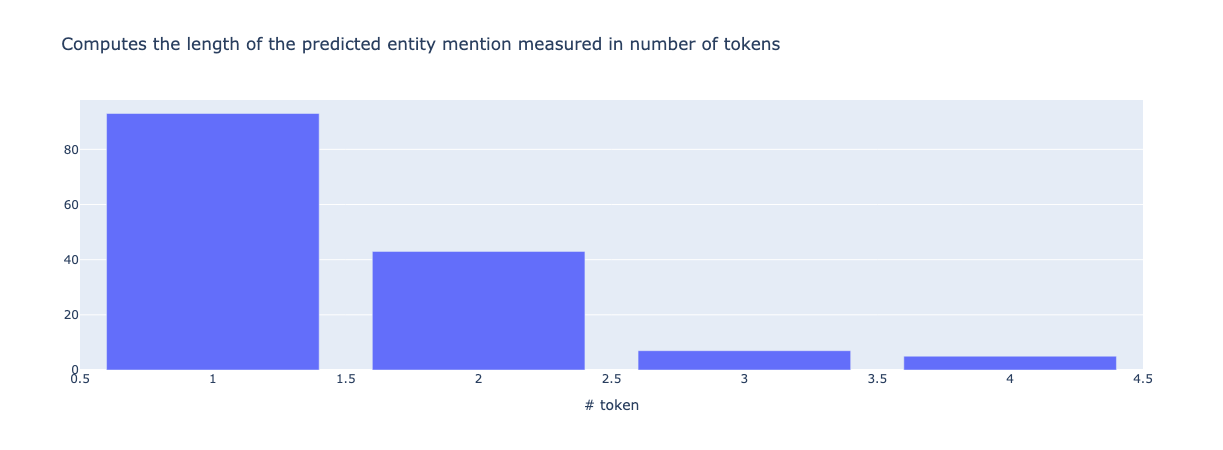
from argilla.metrics.token_classification import mention_length

mention_length(name="spacy_sm_wnut17").visualize()
2. NER training metrics#
Analyze tags#
Let’s analyze the conll2002 dataset at the tag level.
dataset = load_dataset("conll2002", "es", split="train[0:5000]")
def parse_entities(record):
    entities = []
    counter = 0
    for i in range(len(record["ner_tags"])):
        entity = (
            dataset.features["ner_tags"].feature.names[record["ner_tags"][i]],
            counter,
            counter + len(record["tokens"][i]),
        )
        entities.append(entity)
        counter += len(record["tokens"][i]) + 1
    return entities
records = [
    rg.TokenClassificationRecord(
        text=" ".join(example["tokens"]),
        tokens=example["tokens"],
        annotation=parse_entities(example),
    )
    for example in dataset
]
rg.log(records, "conll2002_es")
from argilla.metrics.token_classification import top_k_mentions
from argilla.metrics.token_classification.metrics import Annotations

top_k_mentions(
    name="conll2002_es",
    k=30,
    threshold=4,
    compute_for=Annotations
).visualize()
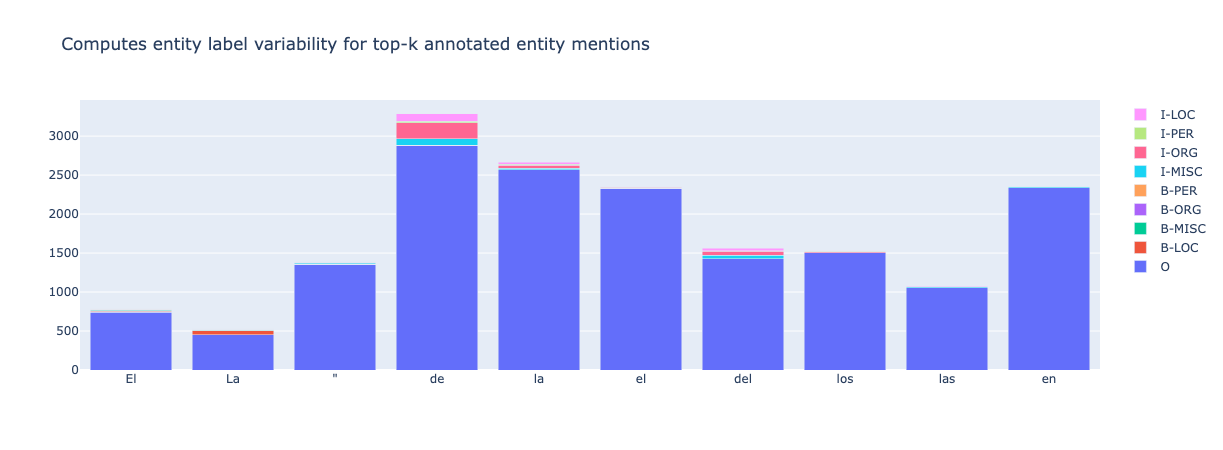
From the above, we see we can quickly detect an annotation issue: double quotes " are most of the time tagged as O (no entity) but in some cases (~60 examples) are tagged as the beginning of entities like ORG or MISC, which is likely a hand-labeling error, including the quotes inside the entity span.
from argilla.metrics.token_classification import *

entity_density(name="conll2002_es", compute_for=Annotations).visualize()
3. TextClassification metrics#
from datasets import load_dataset
from transformers import pipeline

import argilla as rg

sst2 = load_dataset("glue", "sst2", split="validation")
labels = sst2.features["label"].names
nlp = pipeline("sentiment-analysis")
records = [
    rg.TextClassificationRecord(
        text=record["sentence"],
        annotation=labels[record["label"]],
        prediction=[
            (pred["label"].lower(), pred["score"]) for pred in nlp(record["sentence"])
        ],
    )
    for record in sst2
]
rg.log(records, name="sst2")
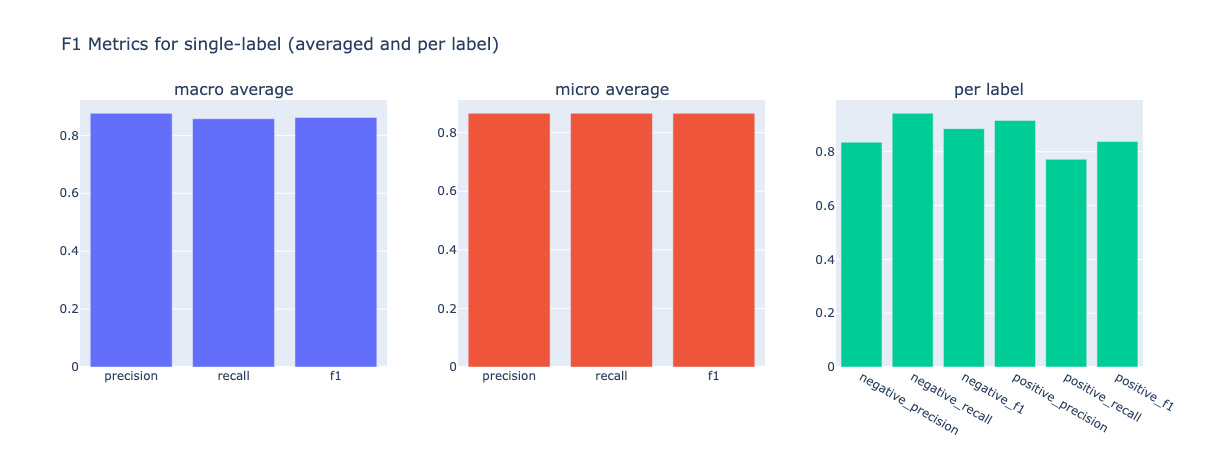
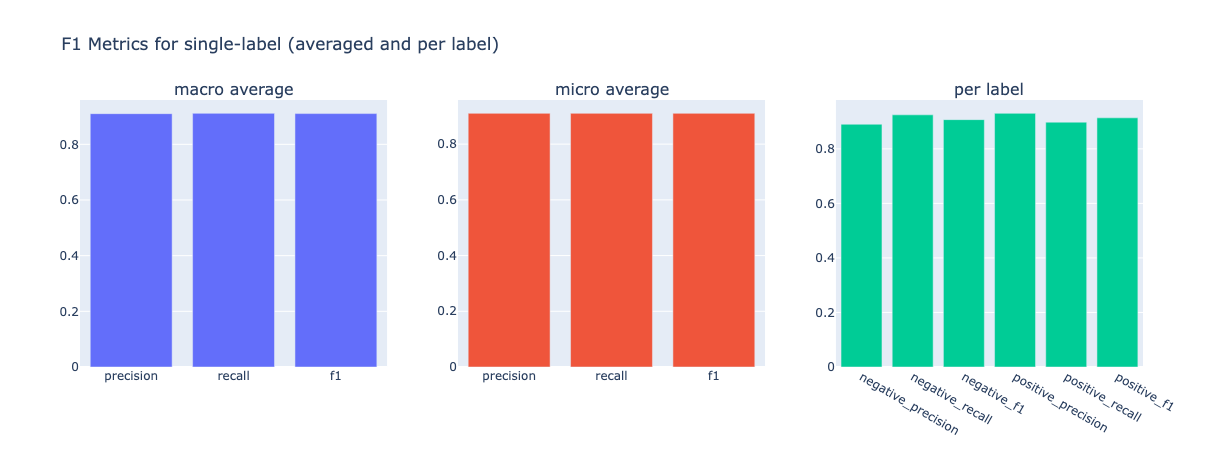
from argilla.metrics.text_classification import f1

f1(name="sst2").visualize()
# now compute metrics for negation ( -> negative precision and positive recall go down)
f1(name="sst2", query="n't OR not").visualize()