Pages#
Home page#
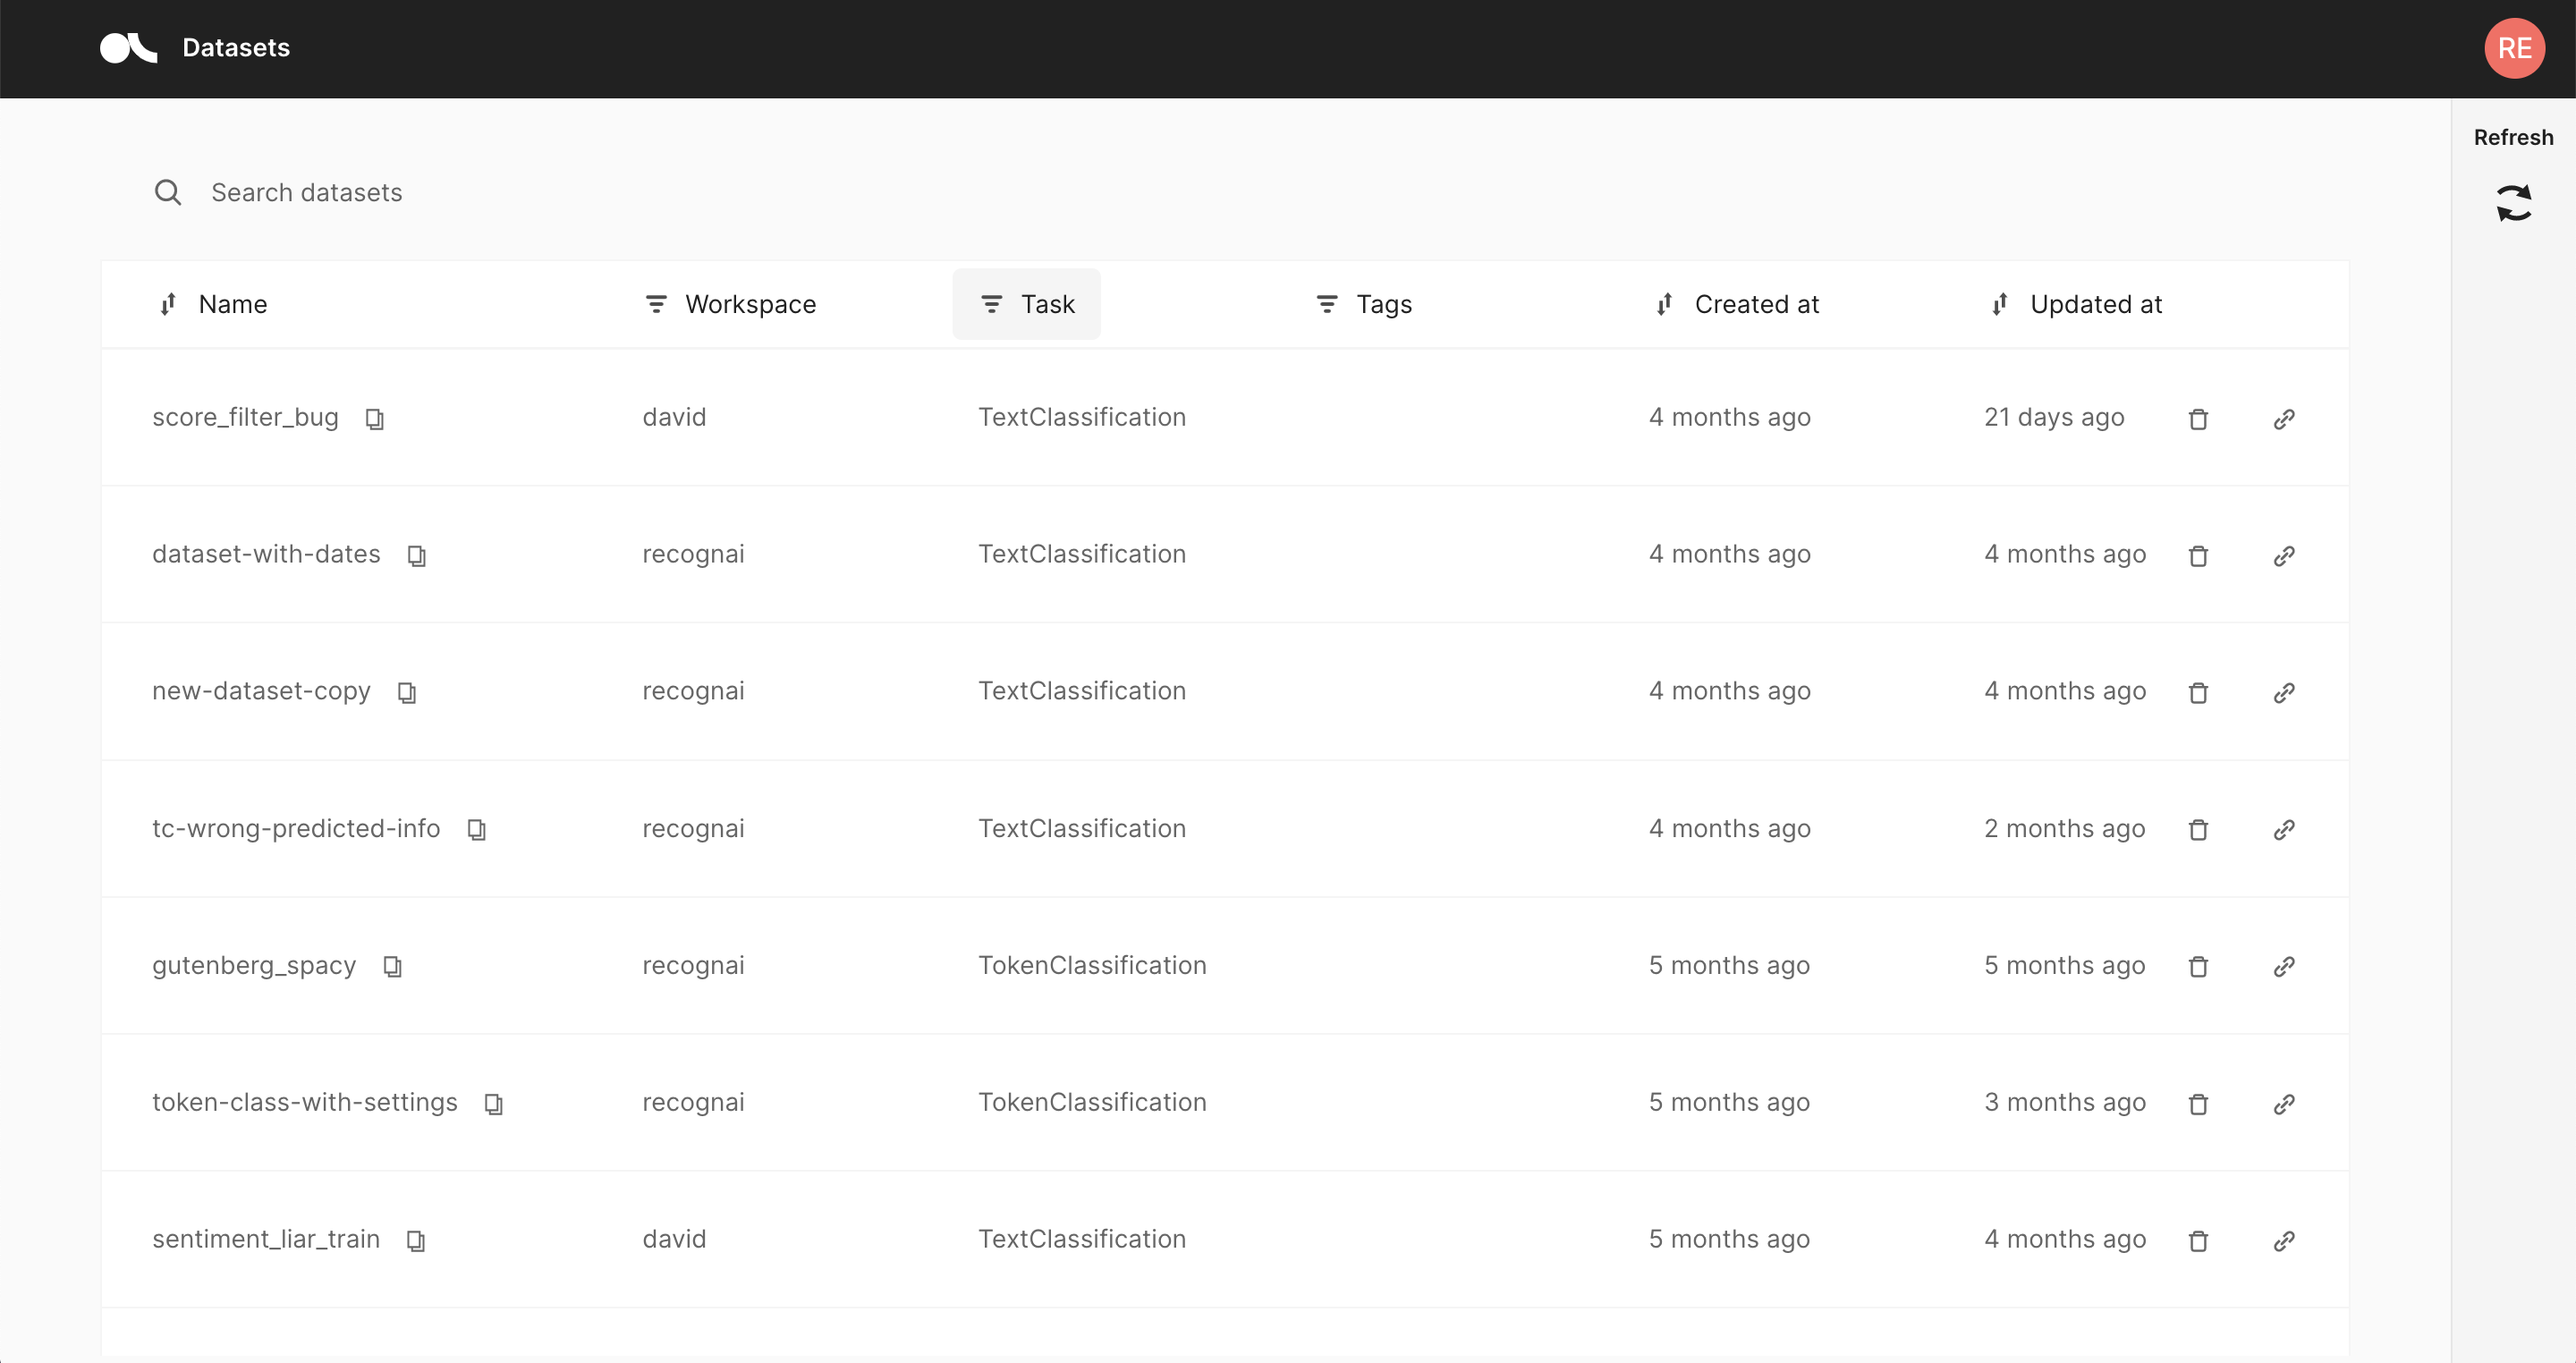
The Home page is mainly a filterable, searchable and sortable list of datasets. It is the entry point to the Argilla web app and is composed of the following three components.
Search bar#
The “Search datasets” bar on the top allows you to search for a specific dataset by its name.
Dataset list#
In the center of the page you see the list of datasets available for your user account. The list consists of following columns:
Name: The name of the dataset, can be sorted alphabetically.
Workspace: A filterable column showing the workspace to which the dataset belongs.
Task: The task of the dataset. This is a filterable column.
Tags: User defined tags for the dataset.
Created at: When was the dataset first logged by the client.
Updated at: When was the dataset last modified, either via the Argilla web app or the client.
Side bar#
You can find a user icon and a refresh button on the top right:
User icon: This icon shows the initials of your username and allows you to view the documentation, view your current Argilla version, and log out.
Refresh: This button updates the list of datasets in case you just logged new data from the client.
Dataset#
The Dataset page is the main page of the Argilla web app. From here you can access most of Argilla’s features, like exploring and annotating the records of your dataset.
The page is composed of 4 major components:
Search bar#
Argilla’s search bar is a powerful tool that allows you to thoroughly explore your dataset, and quickly navigate through the records. You can either fuzzy search the contents of your records, or use the more advanced query string syntax of Elasticsearch to take full advantage of Argilla’s data models. You can find more information about how to use the search bar in our detailed search guide.
Filters#
The filters provide a quick and intuitive way to filter and sort your records with respect to various parameters. You can find more information about how to use the filters in our detailed filter guide.
Record cards#
The record cards are at the heart of the Dataset page and contain your data. There are three different flavors of record cards depending on the task of your dataset. All of them share the same basic structure showing the input text and a vertical ellipsis (or “kebab menu”) on the top right that lets you access the record’s metadata. Predictions and annotations are shown depending on the current mode and task of the dataset.
Check out our exploration and annotation guides to see how the record cards work in the different modes.
Text classification#
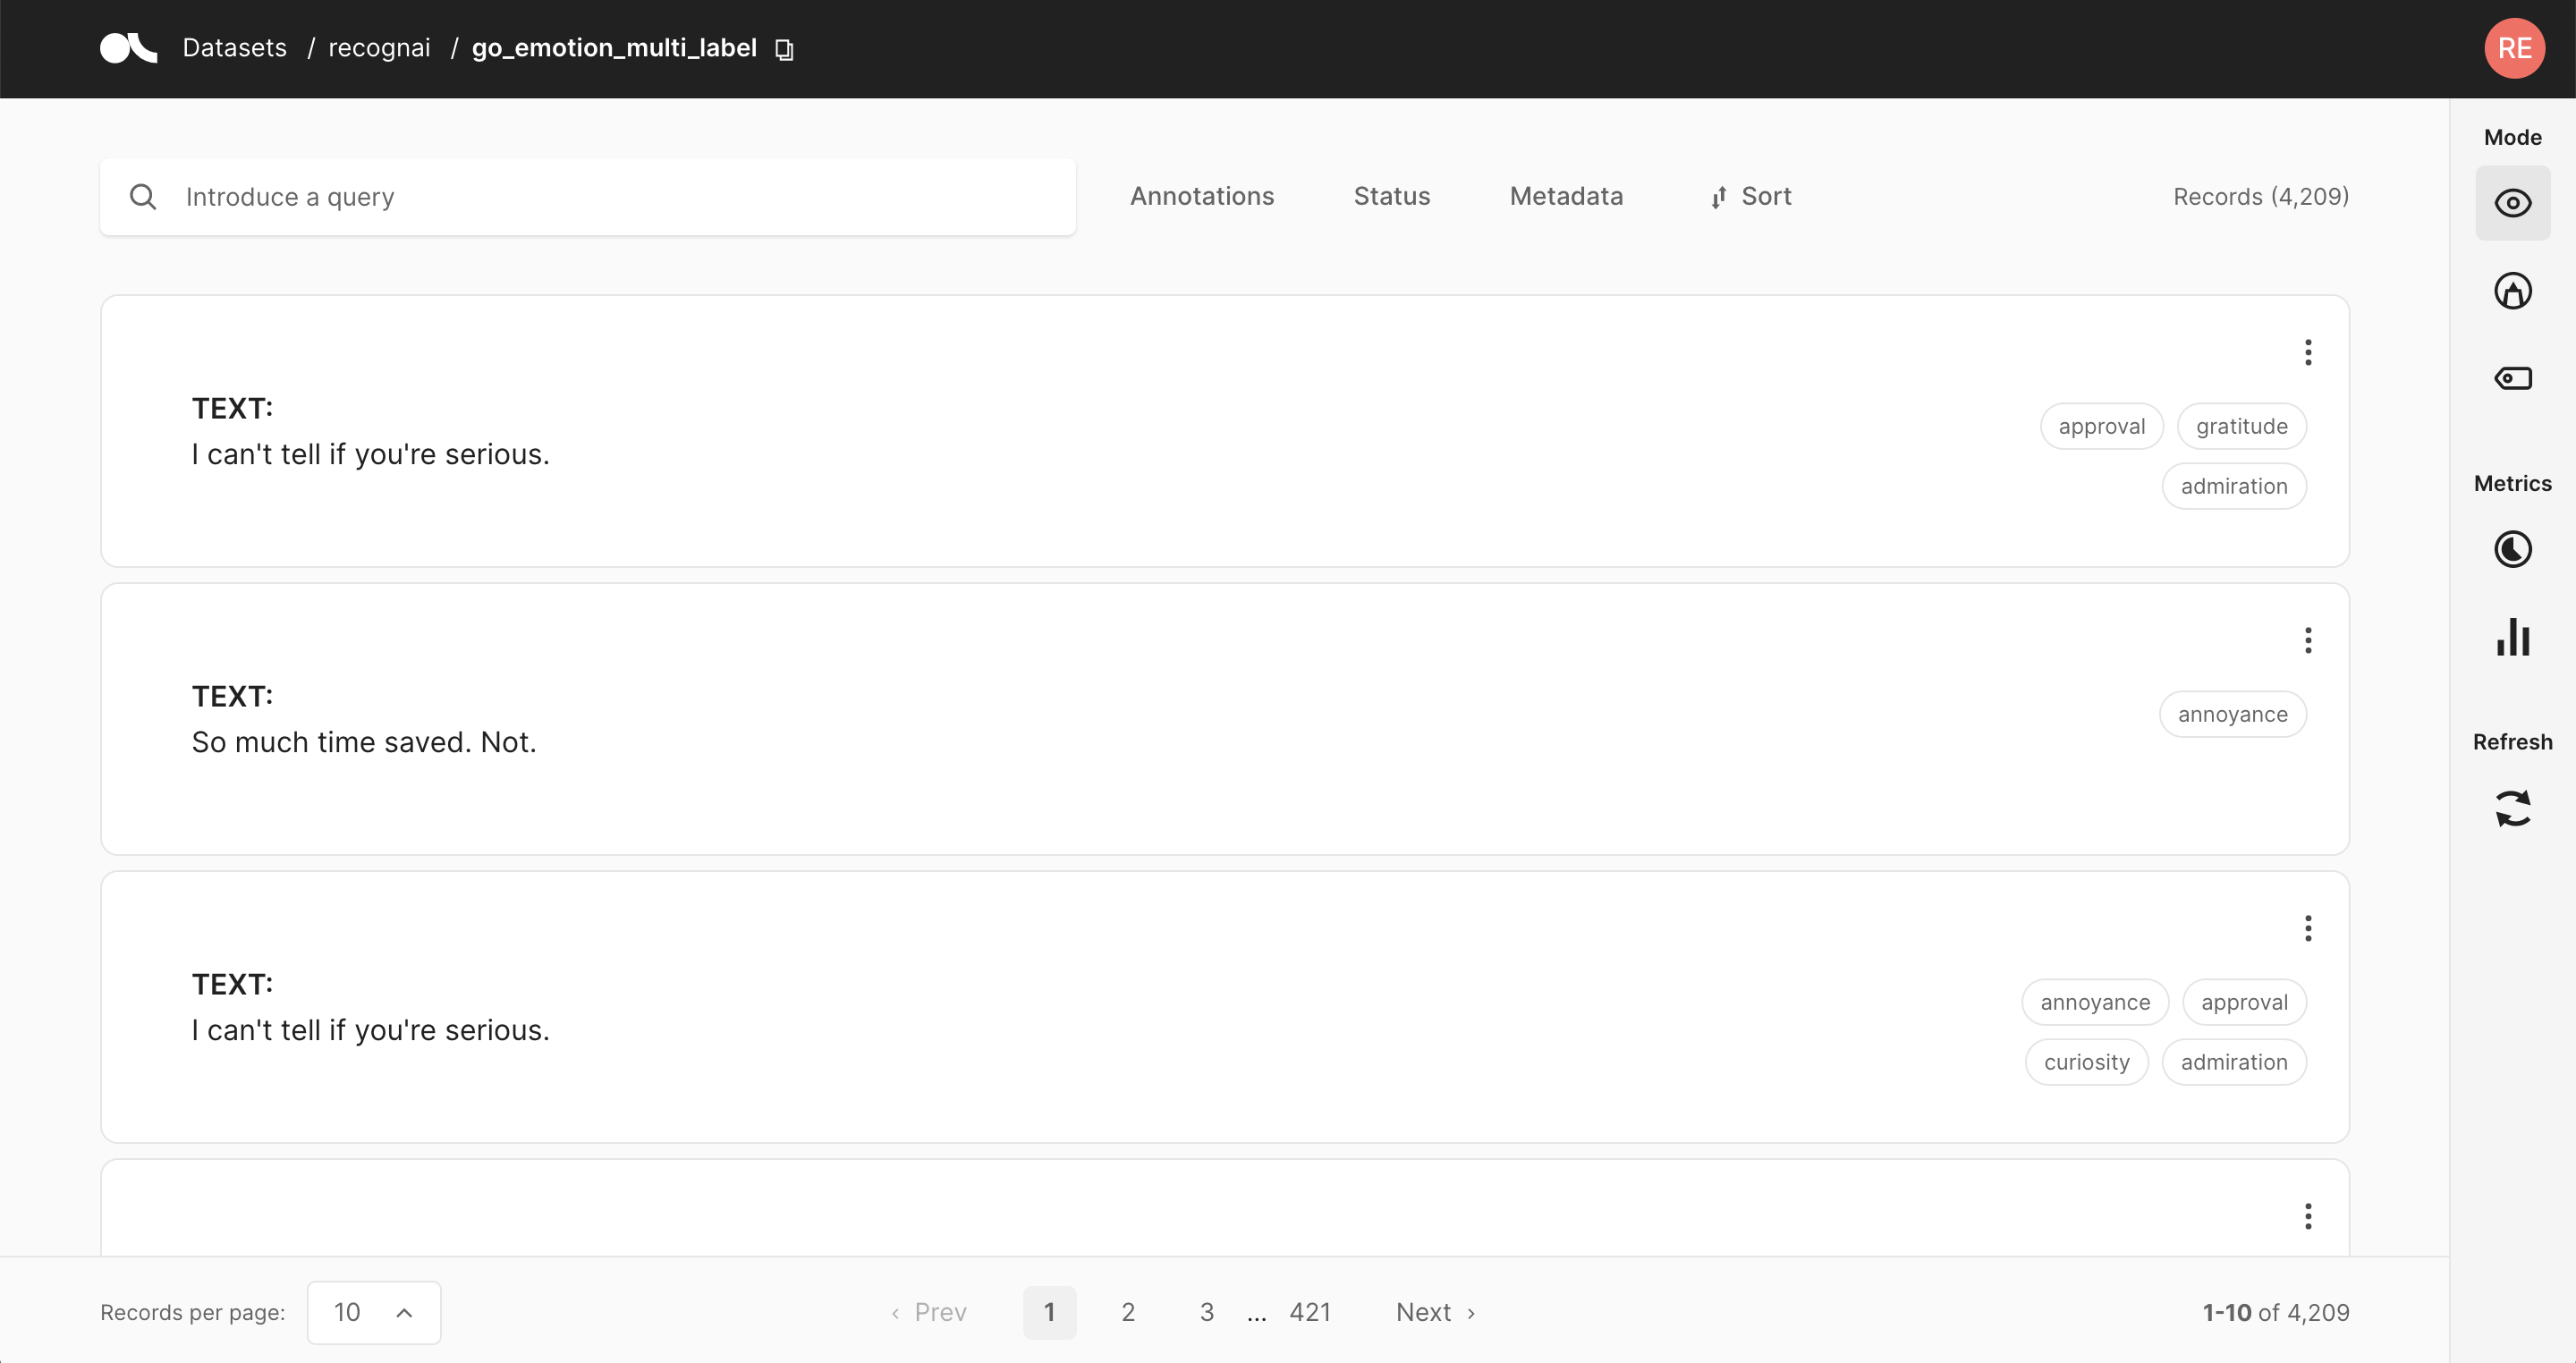
In this task the predictions are given as tags below the input text. They contain the label as well as a percentage score. When in Explore mode annotations are shown as tags on the right together with a symbol indicating if the predictions match the annotations or not. When in Annotate mode predictions and annotations share the same labels (annotation labels are darker).
A text classification dataset can support either single-label or multi-label classification - in other words, records are either annotated with one single label or various.
Token classification#
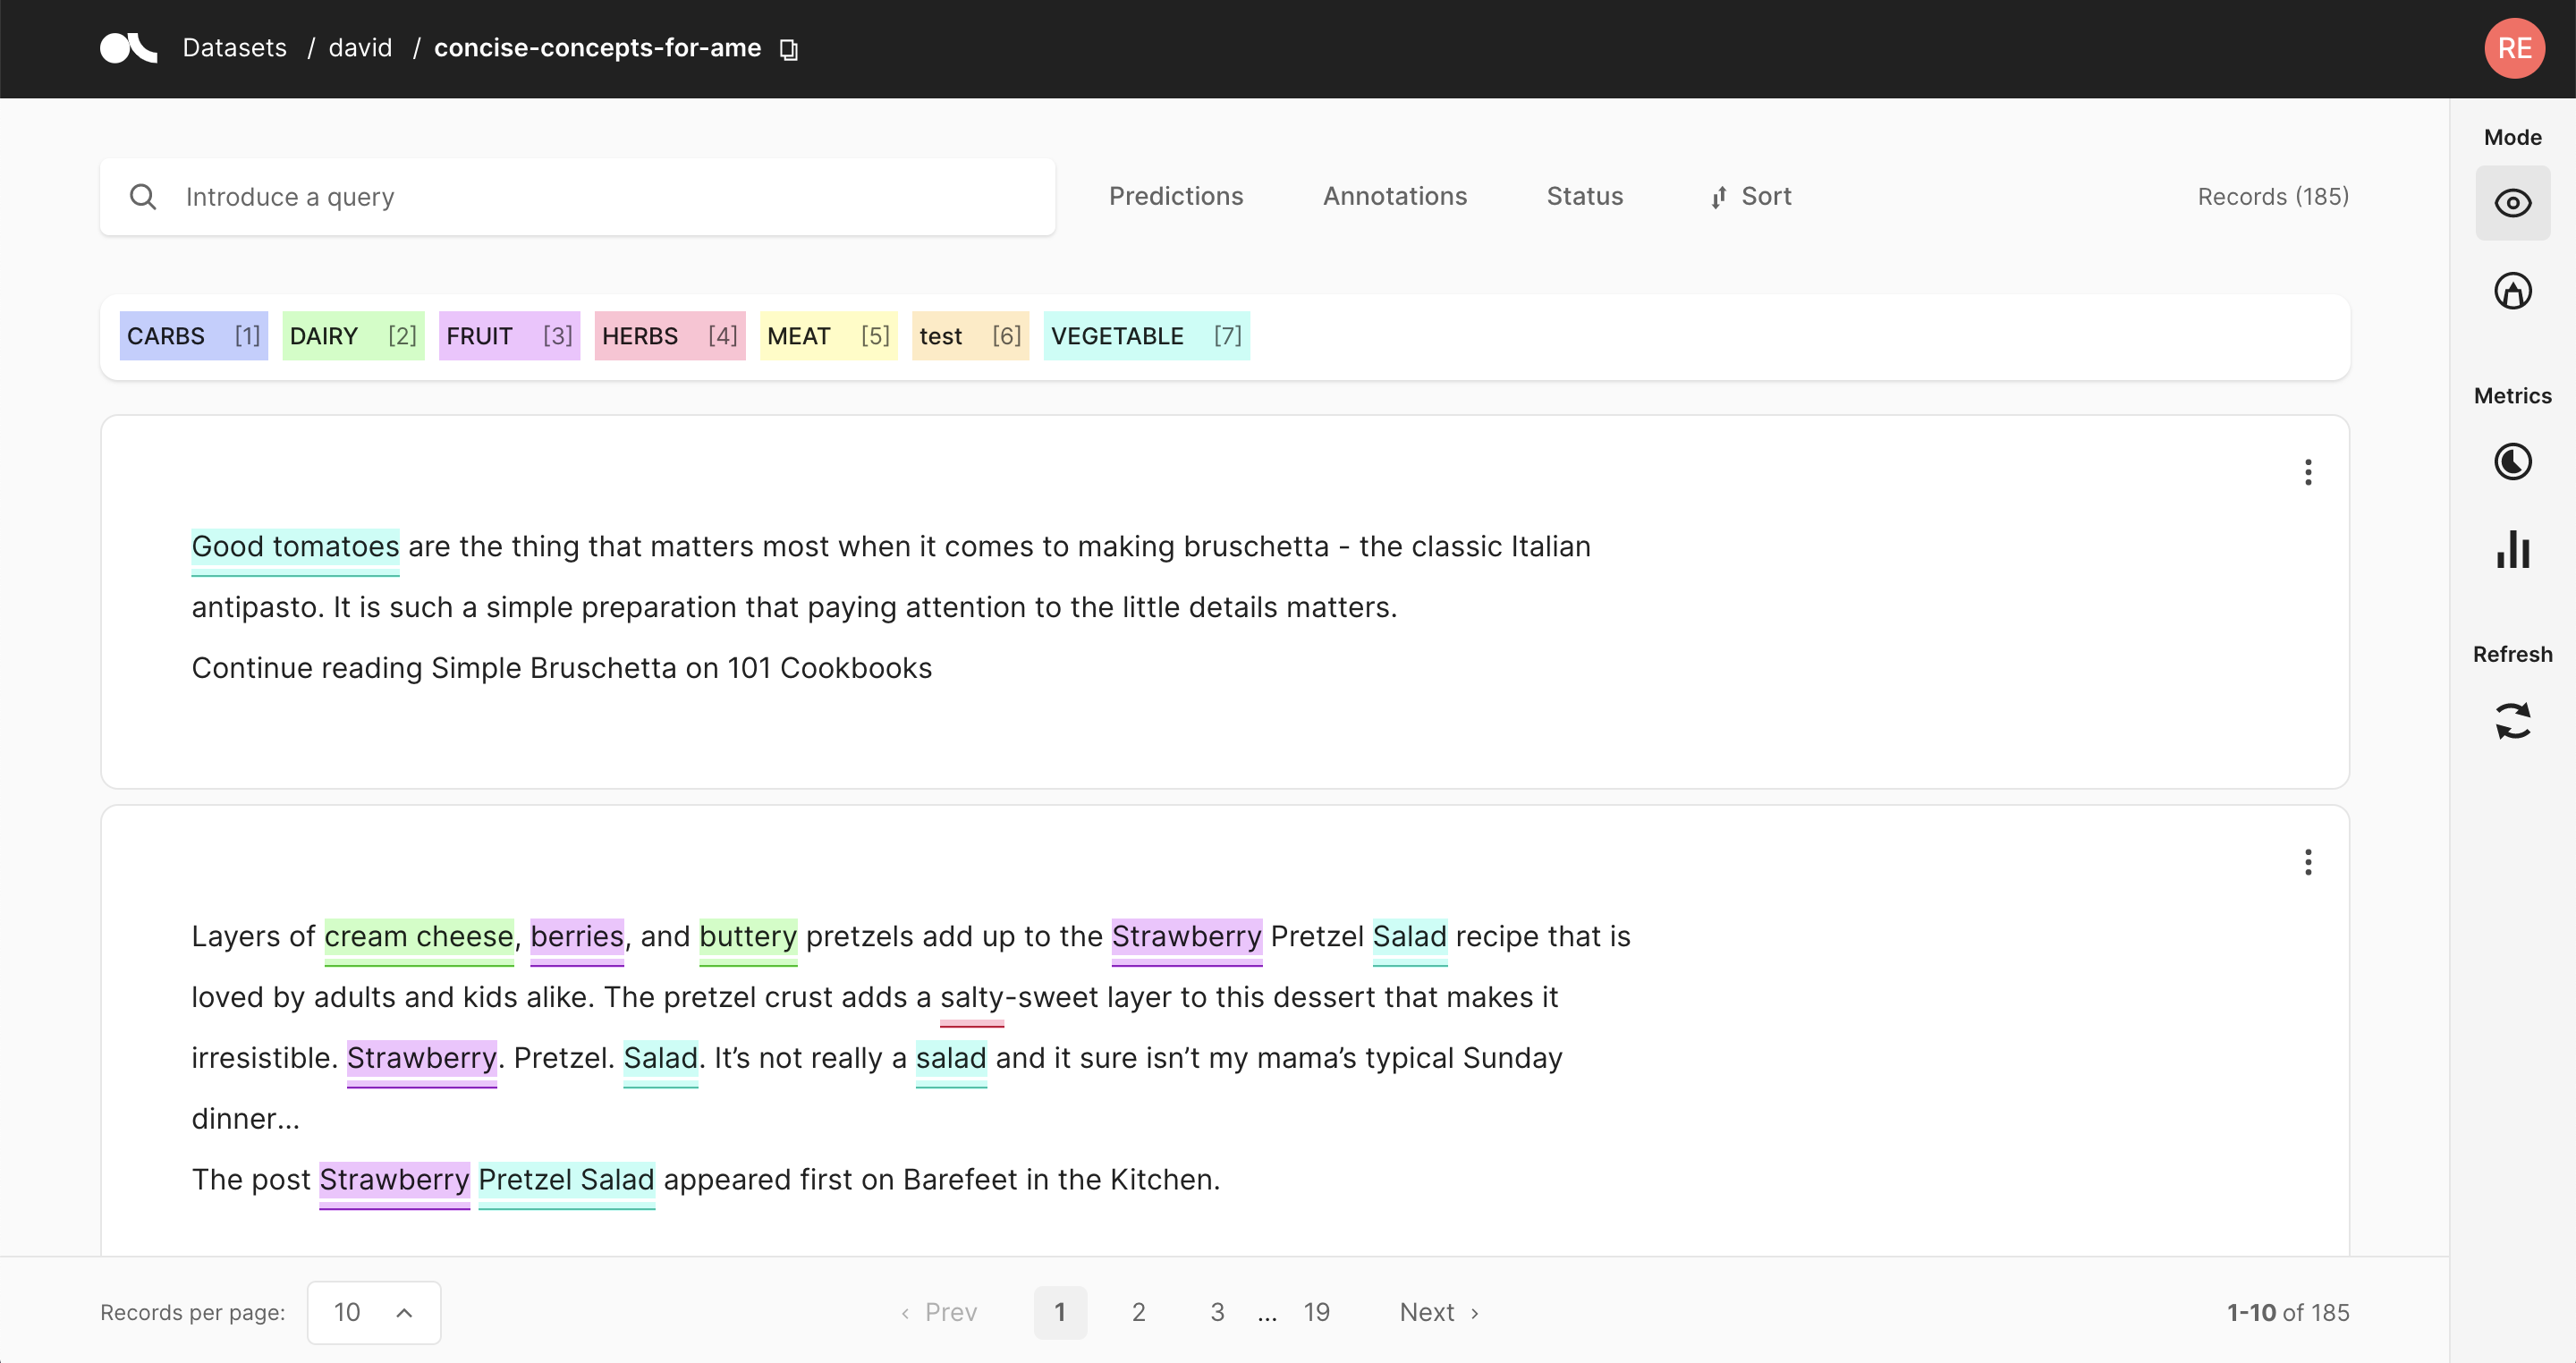
In this task annotations are given as colored highlights in the input text, while predictions are indicated by underlines. At the top of the record list you will find a legend that connects the colors to the respective labels. When in Annotate mode you can remove annotations or add new ones by simply selecting the desired text.
Hint
When using the score filter, the predictions that do not fall in the selected range will be missing the solid thin line.
Text2Text#
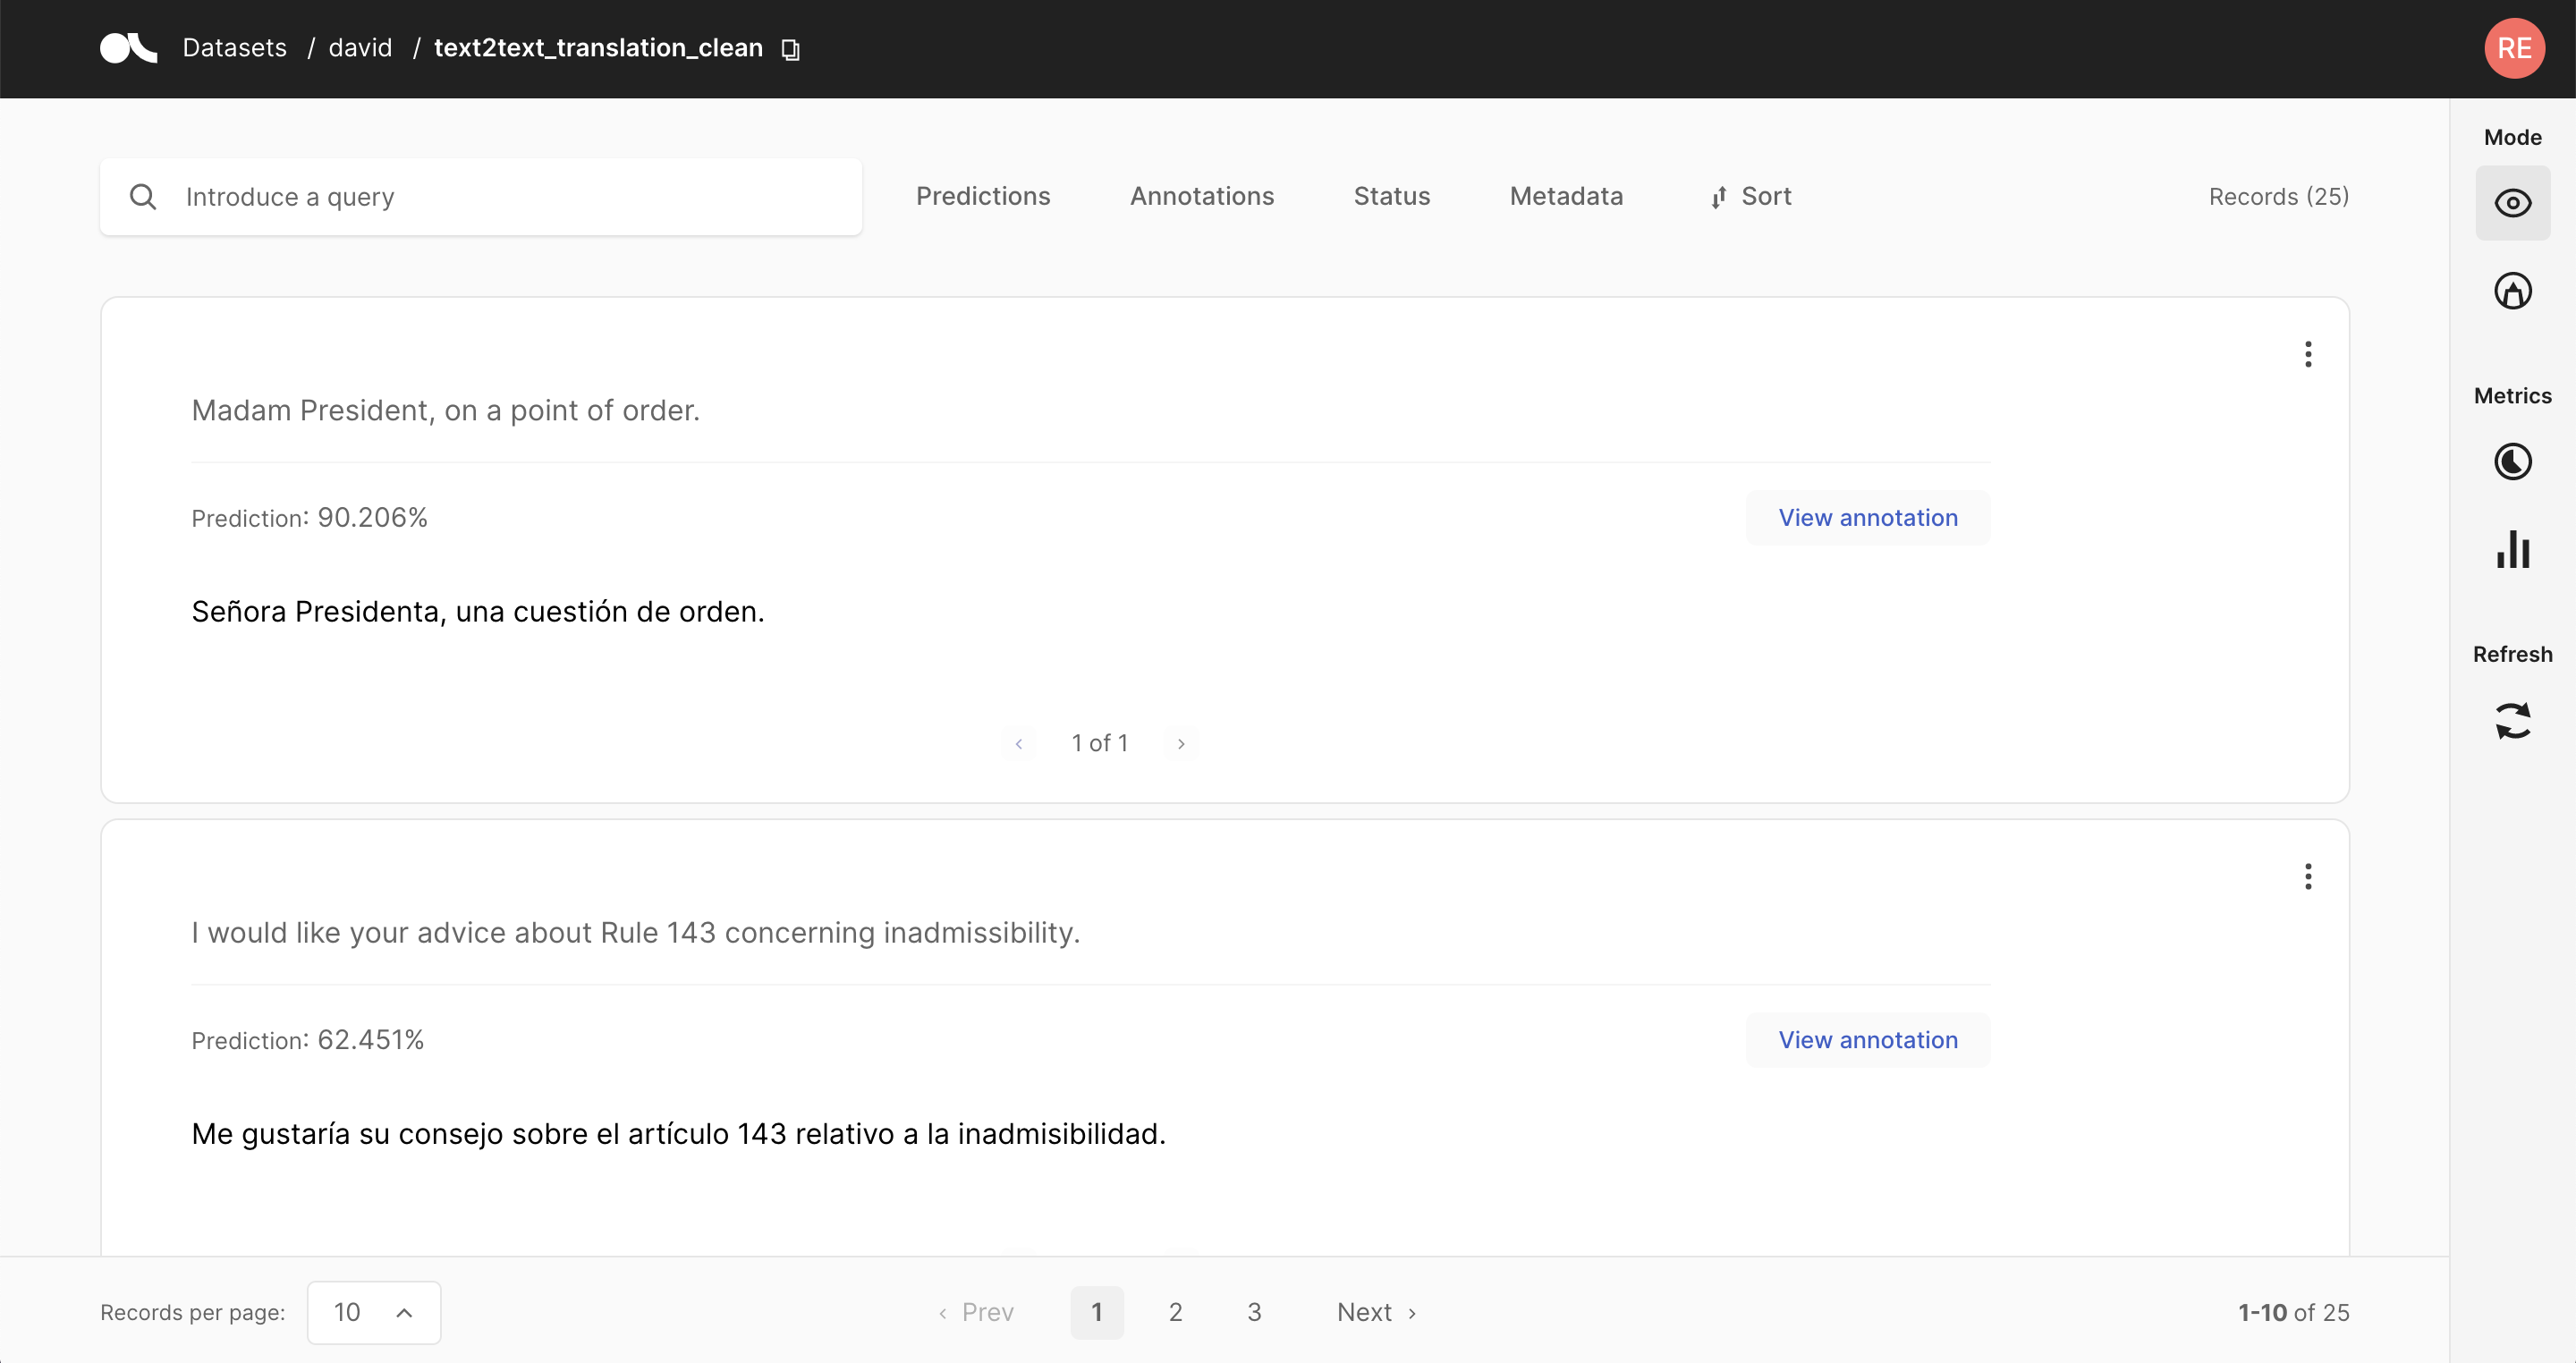
In this task predictions and the annotation are given in a text field below the input text. You can switch between prediction and annotation via the “View annotation”/”View predictions” buttons. For the predictions you can find an associated score in the lower left corner. If you have multiple predictions you can toggle between them using the arrows on the button of the record card.