Pages#
Home page#
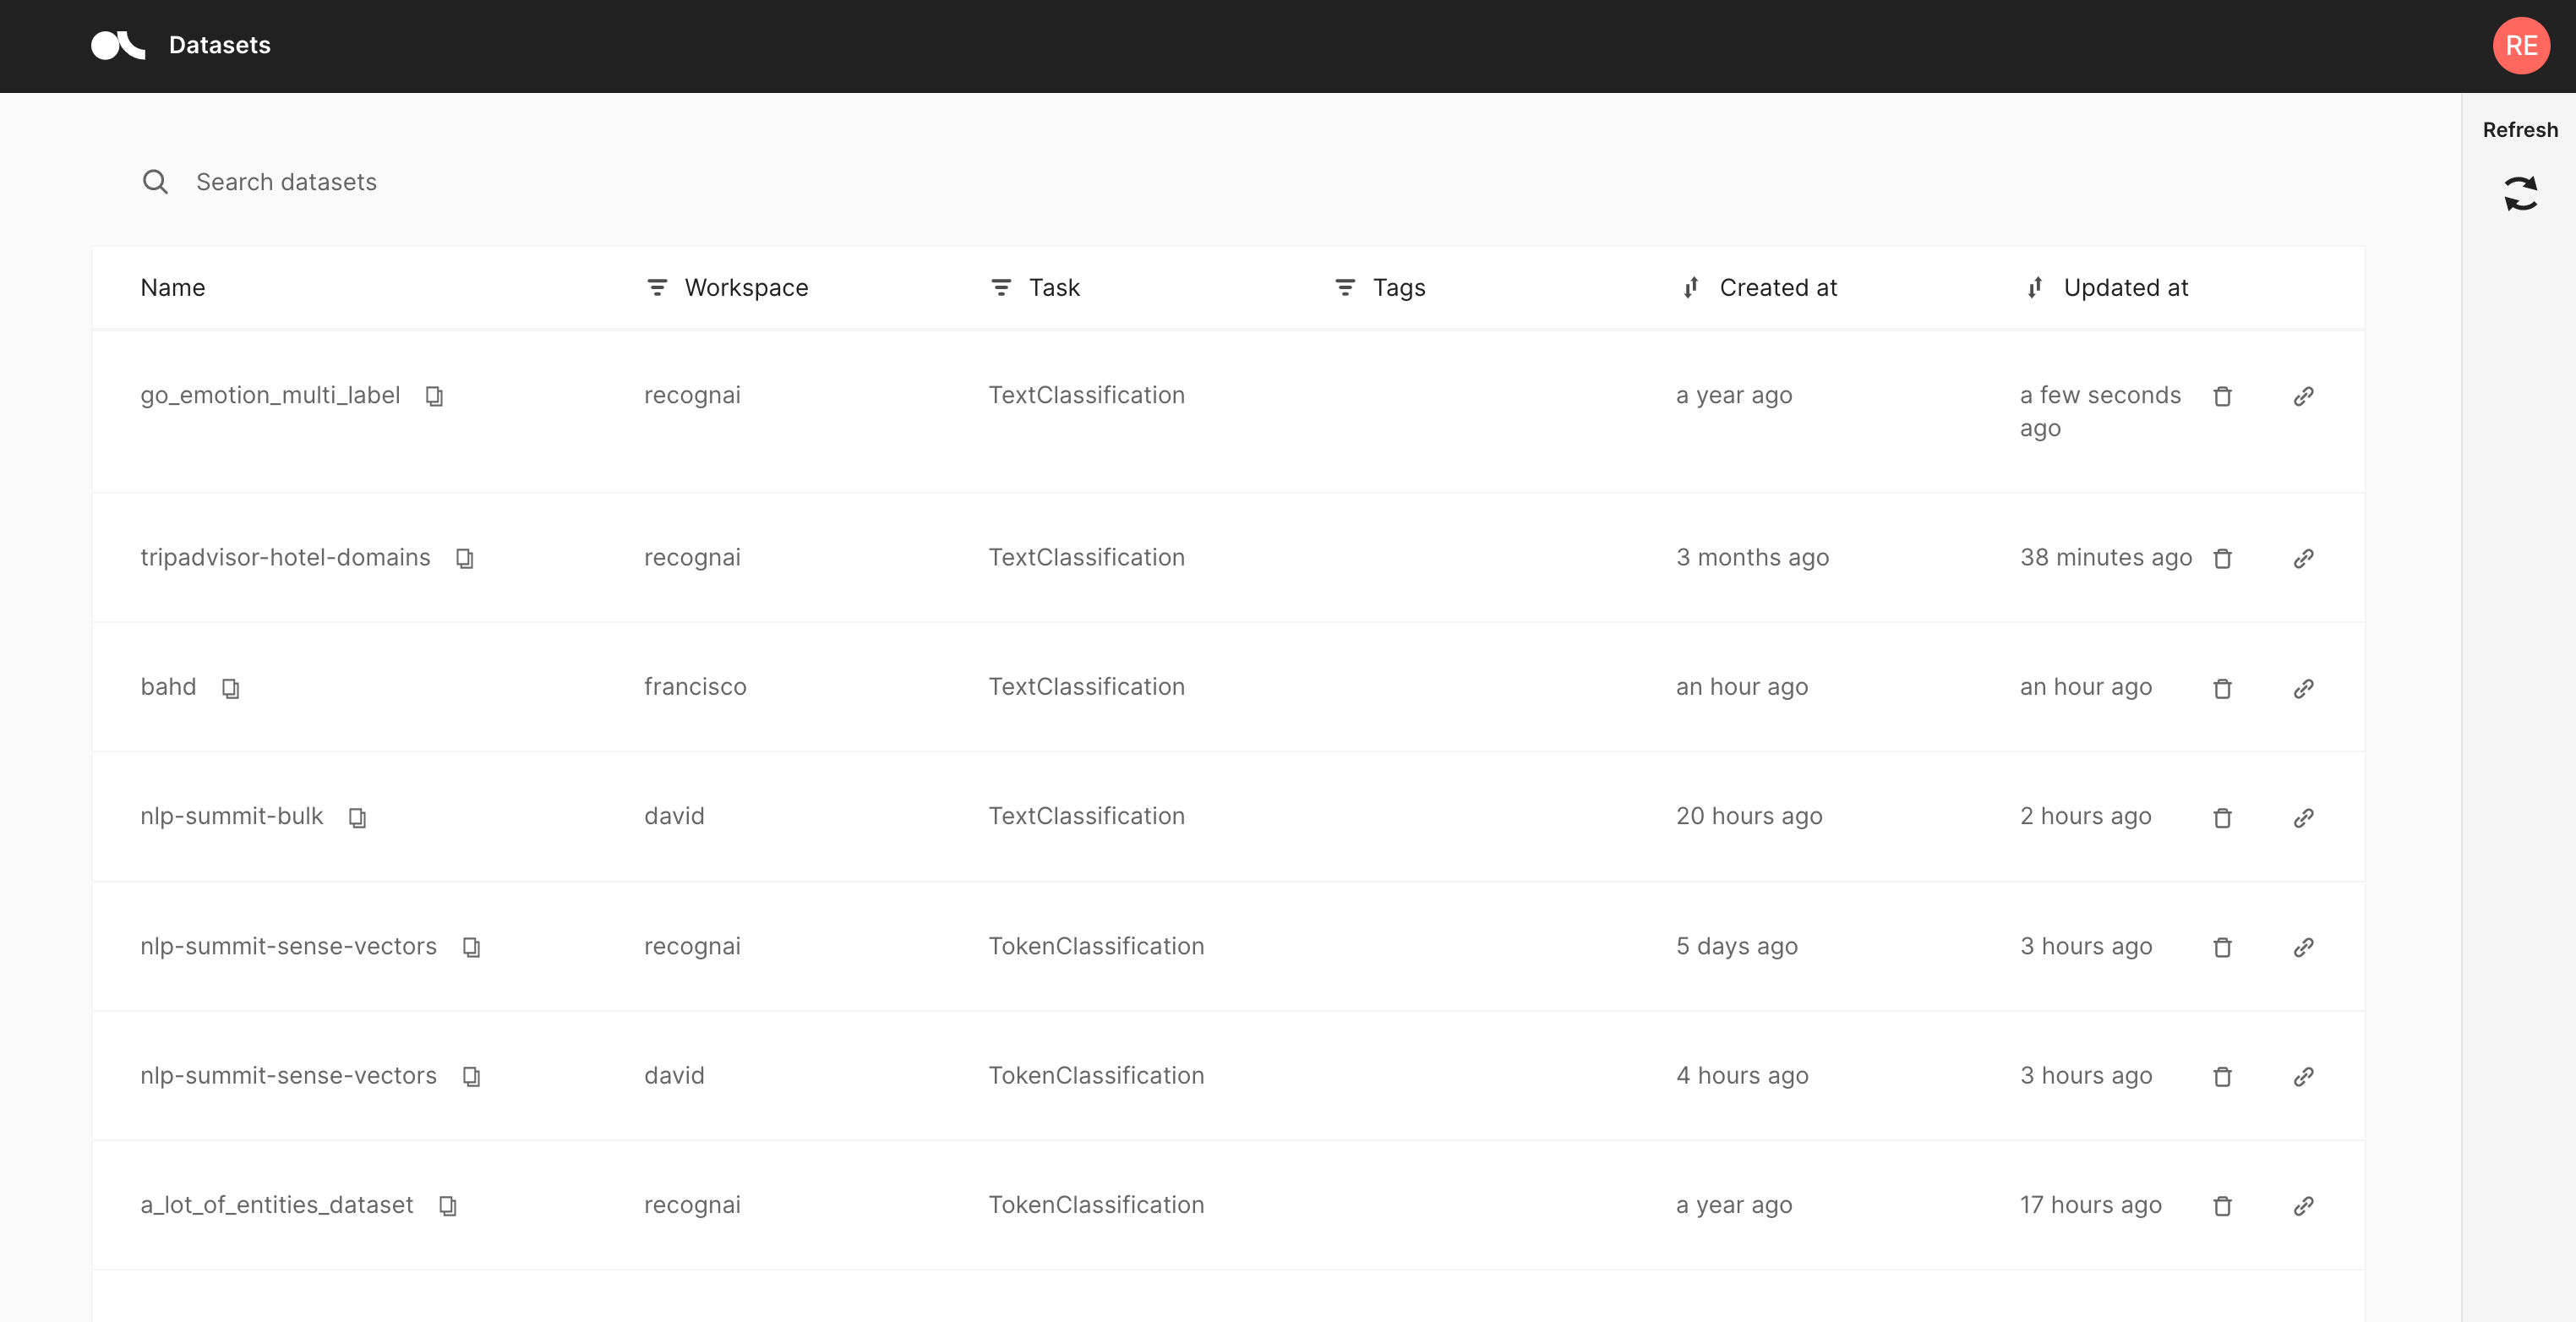
The Home page is mainly a filterable, searchable and sortable list of datasets. It is the entry point to the Argilla web app and is composed of the following three components.
Search bar#
The “Search datasets” bar on the top allows you to search for a specific dataset by its name.
Dataset list#
In the center of the page you see the list of datasets available for your user account. The list consists of the following columns:
Name: The name of the dataset, can be sorted alphabetically.
Workspace: A filterable column showing the workspace to which the dataset belongs.
Tags: User-defined tags for the dataset.
Created at: When was the dataset first logged by the client.
Updated at: When was the dataset last modified, either via the Argilla web app or the client.
Dataset#
Note
For a description of the UI and features related to the new Feedback Task datasets, please check this guide.
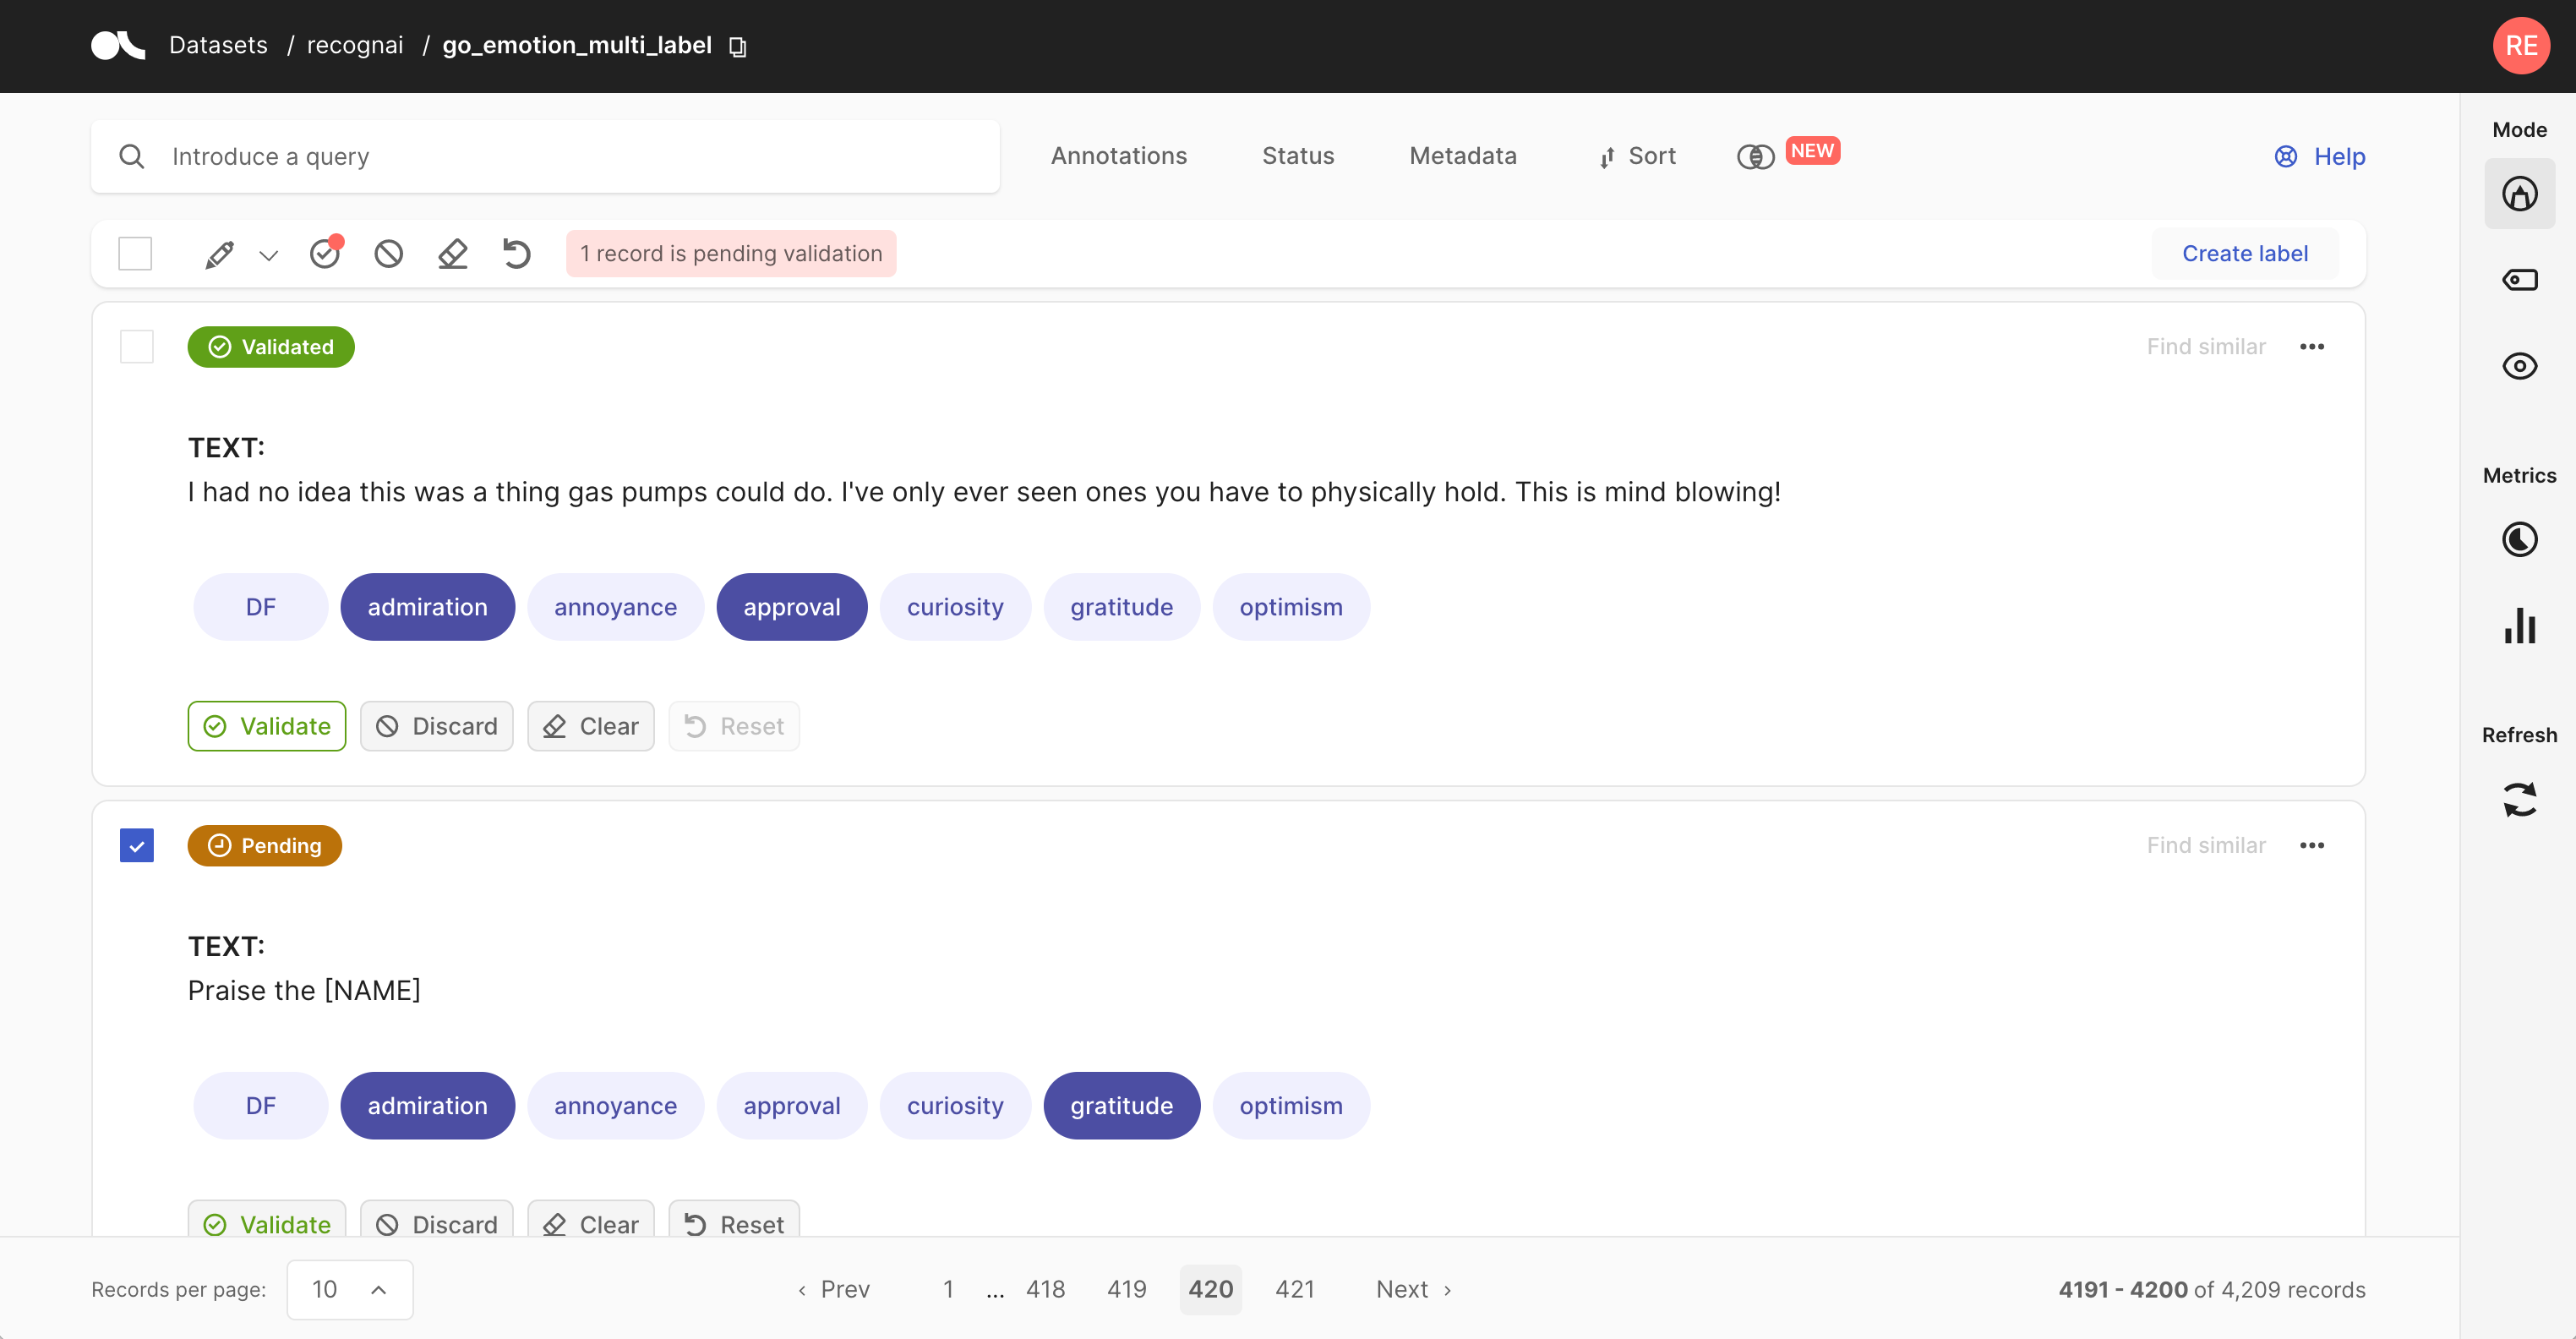
The Dataset page is the main page of the Argilla web app. From here you can access most of Argilla’s features, like exploring and annotating the records of your dataset.
The page is composed of 4 major components:
Search bar#
Argilla’s search bar is a powerful tool that allows you to thoroughly explore your dataset, and quickly navigate through the records. You can either fuzzy search the contents of your records, or use the more advanced query string syntax of Elasticsearch to take full advantage of Argilla’s data models. You can find more information about how to use the search bar in our detailed search guide.
Filters#
The filters provide a quick and intuitive way to filter and sort your records with respect to various parameters. You can find more information about how to use the filters in our detailed filter guide.
Record cards#
The record cards are at the heart of the Dataset page and contain your data. There are three different flavors of record cards depending on the task of your dataset. All of them share the same basic structure showing the input text and a horizontal ellipsis (or “kebab menu”) on the top right that lets you access the record’s metadata. Predictions and annotations are shown depending on the current mode and task of the dataset.
Hint
Use the menu on the bottom left corner of the page to select how many record cards you want to see per page: 1, 20, 50 or 100. This allows you to annotate record by record or in bigger bulks.
Check out our exploration and annotation guides to see how the record cards work in the different modes.
Text classification#
In this task, the predictions are given as tags below the input text. They contain the label as well as a percentage score. When in Explore mode annotations are shown as tags on the right together with a symbol indicating if the predictions match the annotations or not. When in Annotate mode predictions and annotations share the same labels (annotation labels are darker).
A text classification dataset can support either single-label or multi-label classification - in other words, records are either annotated with one or multiple labels.
Note
If the record has multiple inputs, these will appear in alphabetical order.
Token classification#
In this task, annotations are given as colored highlights in the input text, while predictions are indicated by underlines. At the top of the record list, you will find a legend that connects the colors to the respective labels. When in Annotate mode you can remove annotations or add new ones by simply selecting the desired text.
Hint
When using the score filter, the predictions that do not fall in the selected range will be missing the solid thin line.
Text2Text#
In this task, predictions and annotations are displayed at the same level to allow for easy comparison of versions. The user interface supports the display of multiple predictions for one record, ordered by score. In Annotate mode, you can edit a prediction directly in the text box to produce your annotation.
Sidebar#
The right sidebar is divided into three sections.
Modes#
This section of the sidebar lets you switch between the different Argilla modes that are covered extensively in their respective guides:
Hand labeling: this mode lets you conveniently annotate your data
Weak labeling: this mode helps you to define rules to automatically label your data (Text Classification only)
Explore: this mode is for exploring your dataset and gain valuable insights
Metrics#
In this section, you find several “metrics” that can provide valuable insights to your dataset. They also provide some support while annotating your records, or defining heuristic rules. There are three different kinds of metrics:
Progress: see metrics of your annotation process, like its progress and the label distribution (only visible in the Explore and Annotate mode)
Overall rule metrics: see aggregated metrics about your defined rules (only visible in the Define rules mode)
Stats: check the keywords of your dataset (text classification, text generation) or the mentions of your annotations and predictions (token classification)
You can find more information about each metric in our dedicated metrics guide.
Refresh#
This button allows you to refresh the list of the record cards with respect to the activated filters. For example, if you are annotating and use the Status filter to filter out annotated records, you can press the Refresh button to hide the latest annotated records.
Dataset settings#
To access this page, click on the settings icon next to the user icon at the screen’s top right.
On this page, you can access the settings of a specific dataset and make modifications.
Feedback Task#
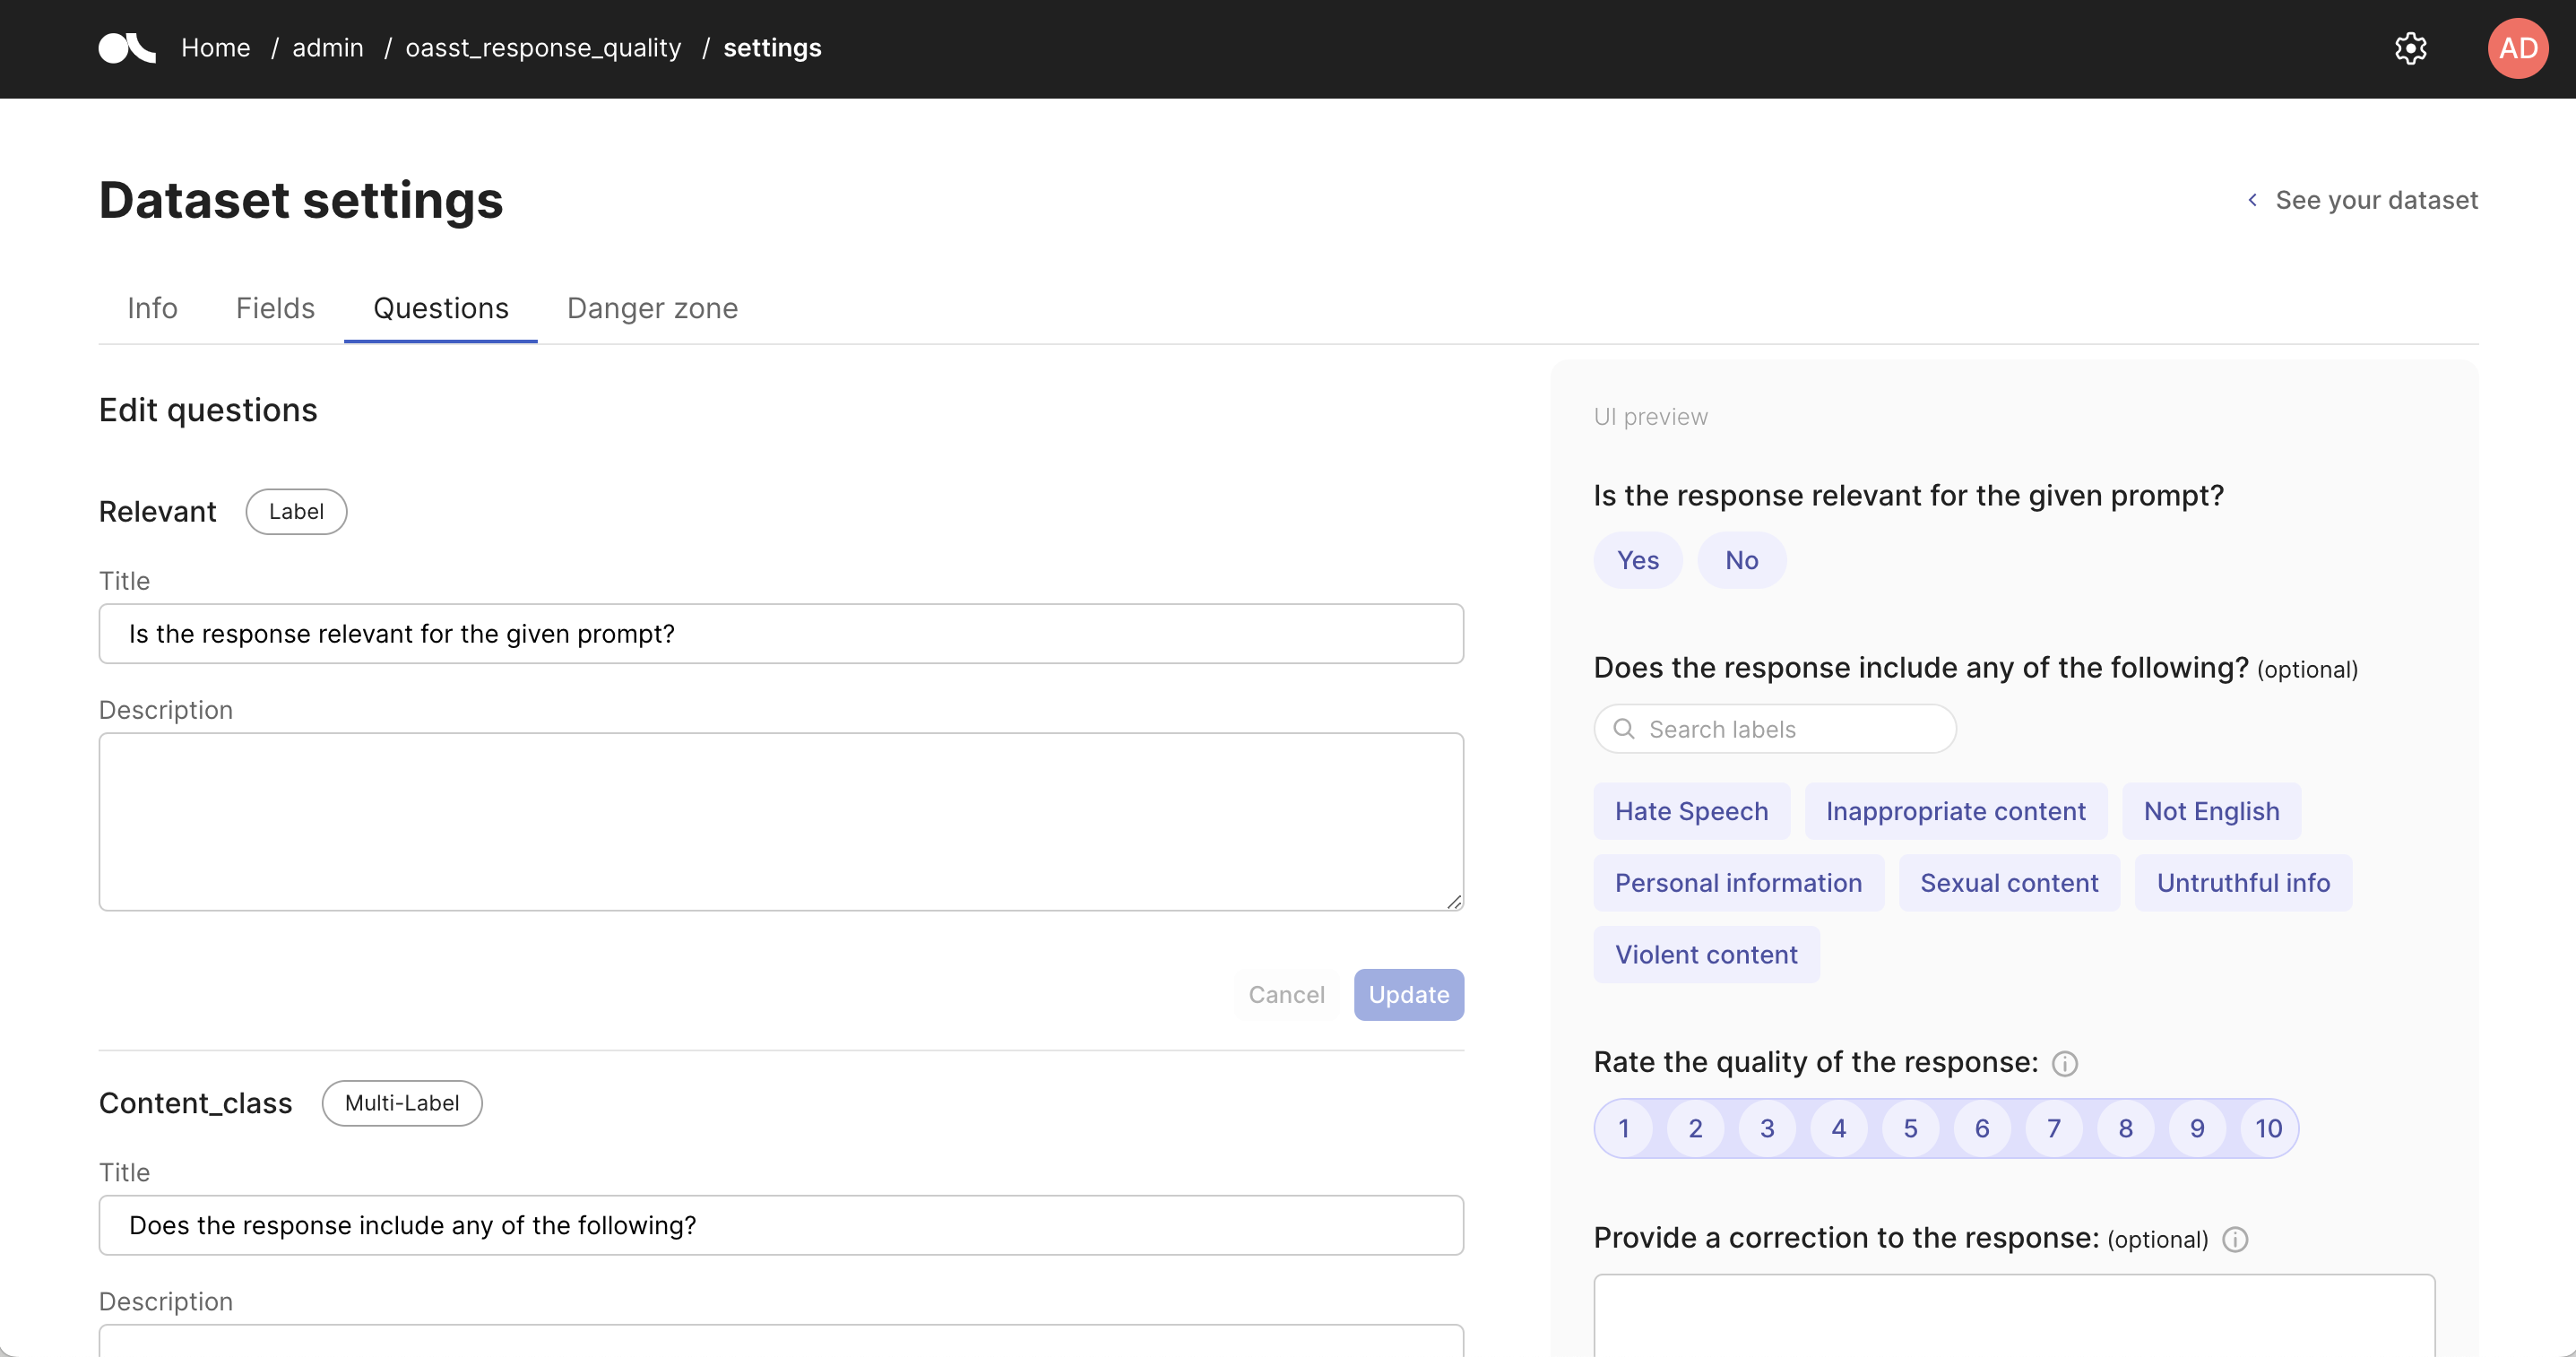
Info#
You can consult and edit the annotation guidelines in markdown format.
Fields#
You can edit each field’s title and activate the markdown format for each.
Questions#
You have the ability to edit questions and their descriptions, activate markdown formatting for each question, and preview the results in real time.
Danger zone#
You can delete your dataset. Be careful this action is irreversible.
Other Tasks#
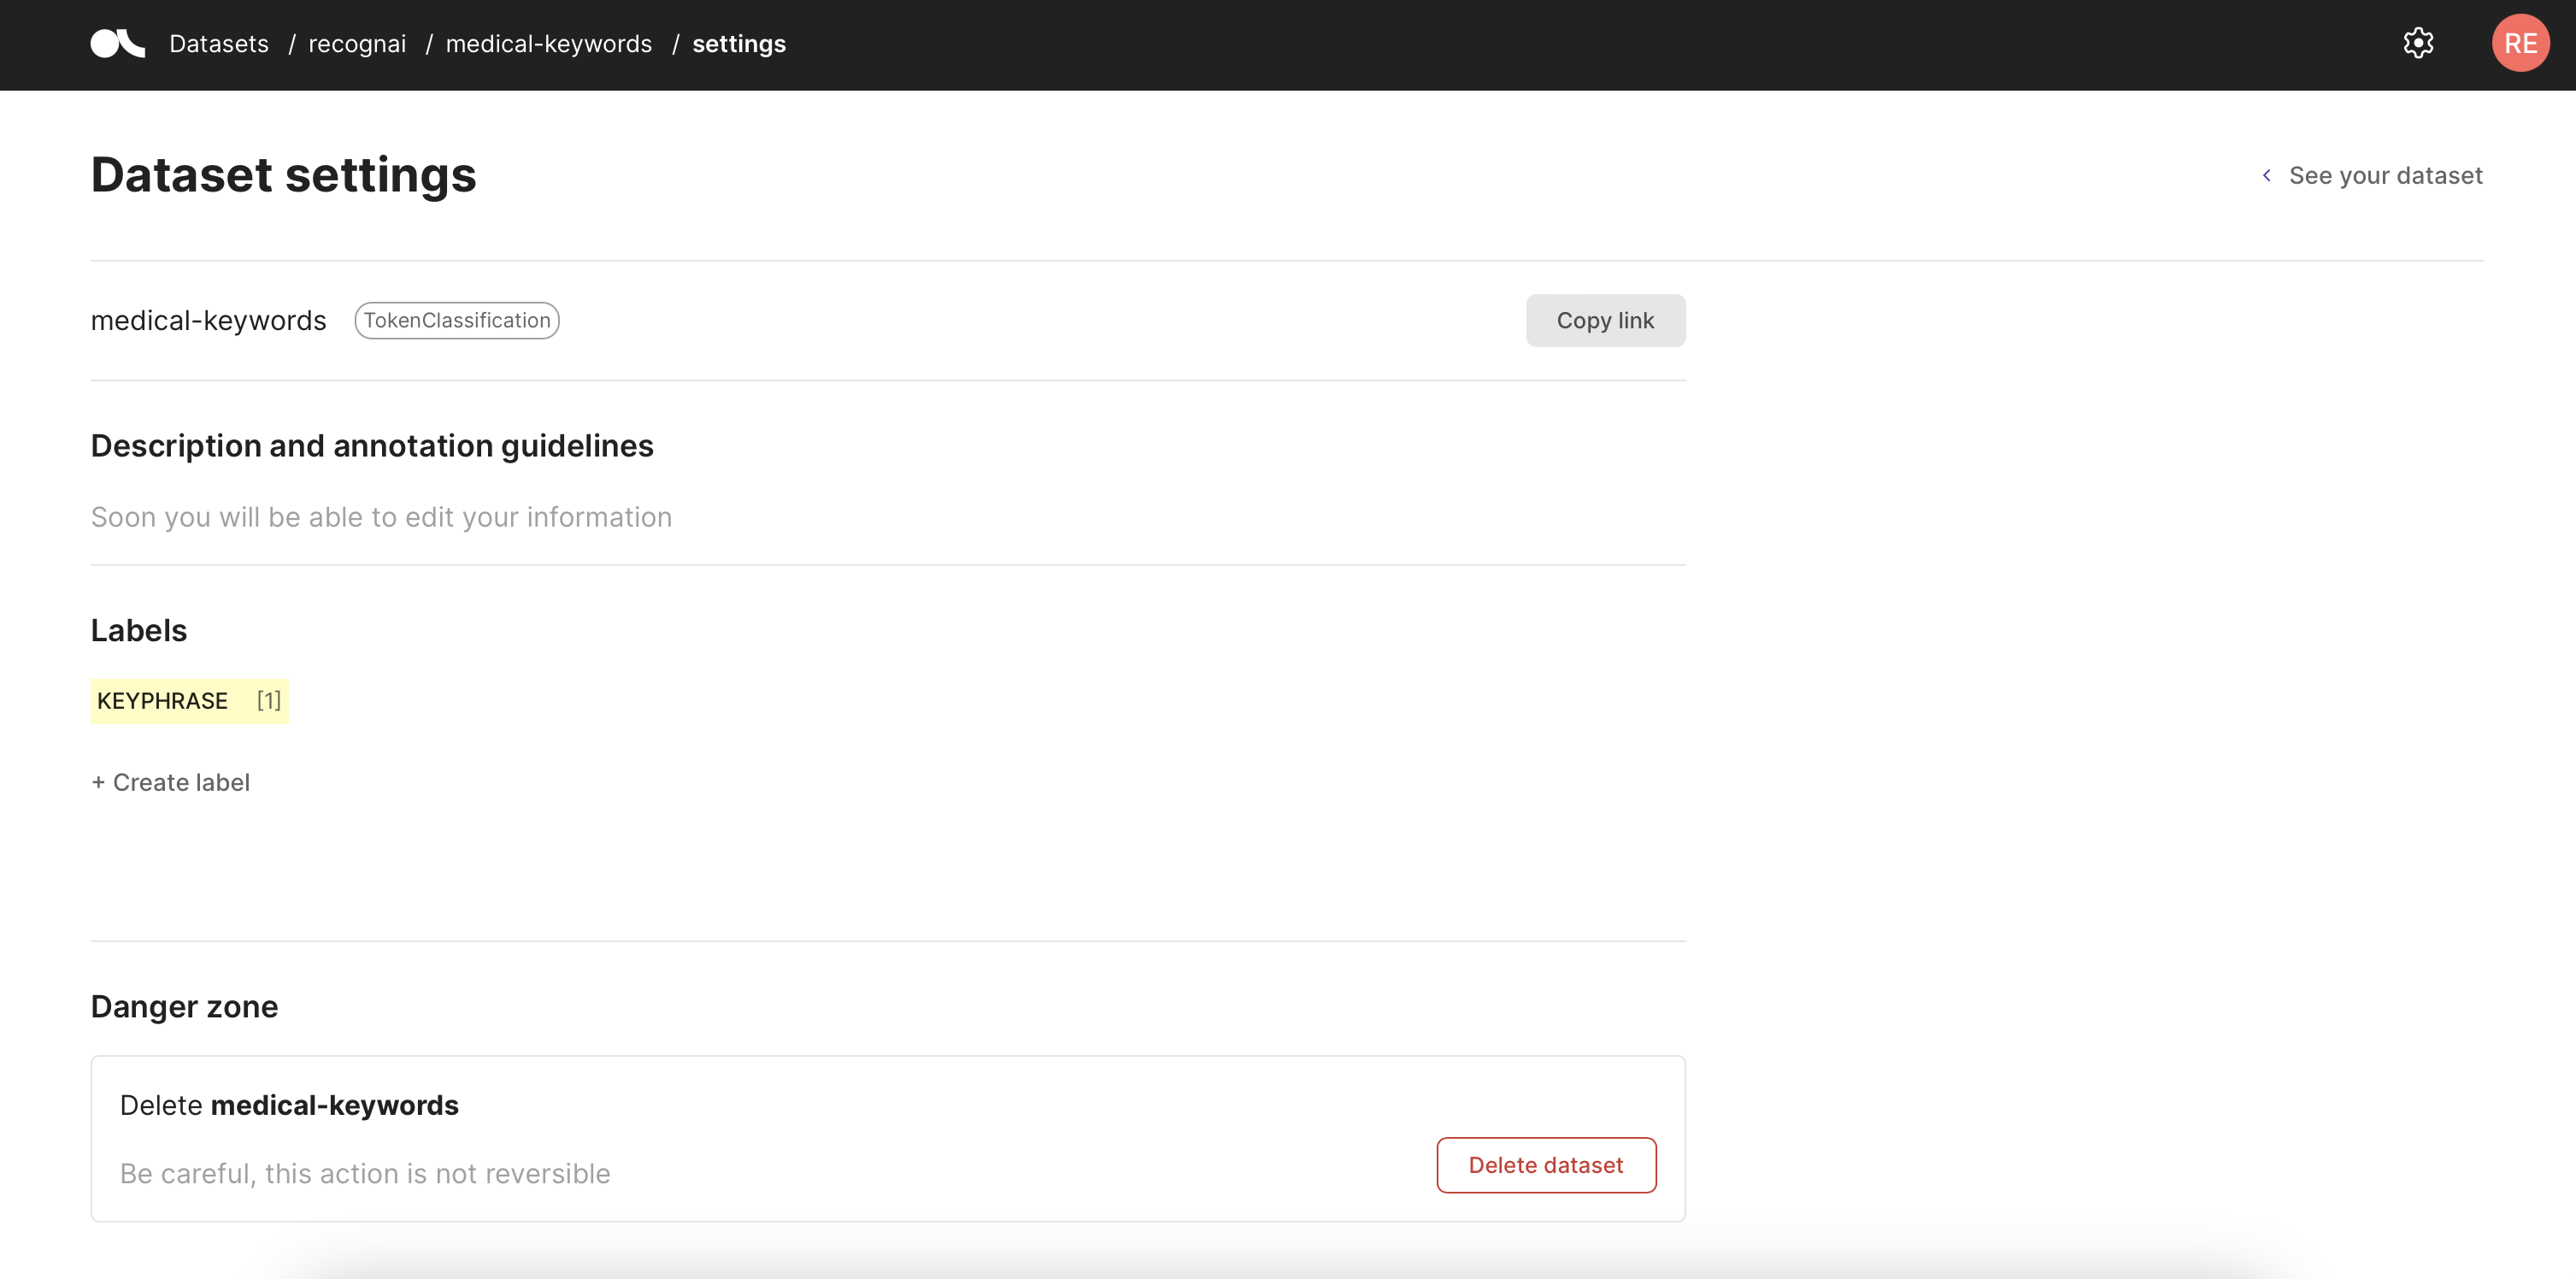
You can access this page by clicking on the settings icon next to the user icon inside of the Dataset view.
In this page, you will be able to access the settings of a specific dataset and make modifications.
Description and annotation guidelines#
Support for editing this will only be added for the Feedback Task dataset.
Labels#
Here you can define your labeling schema for this dataset, see the current one and add new labels to it.
Danger zone#
In this area, you will find a button to delete the current dataset.
User settings#
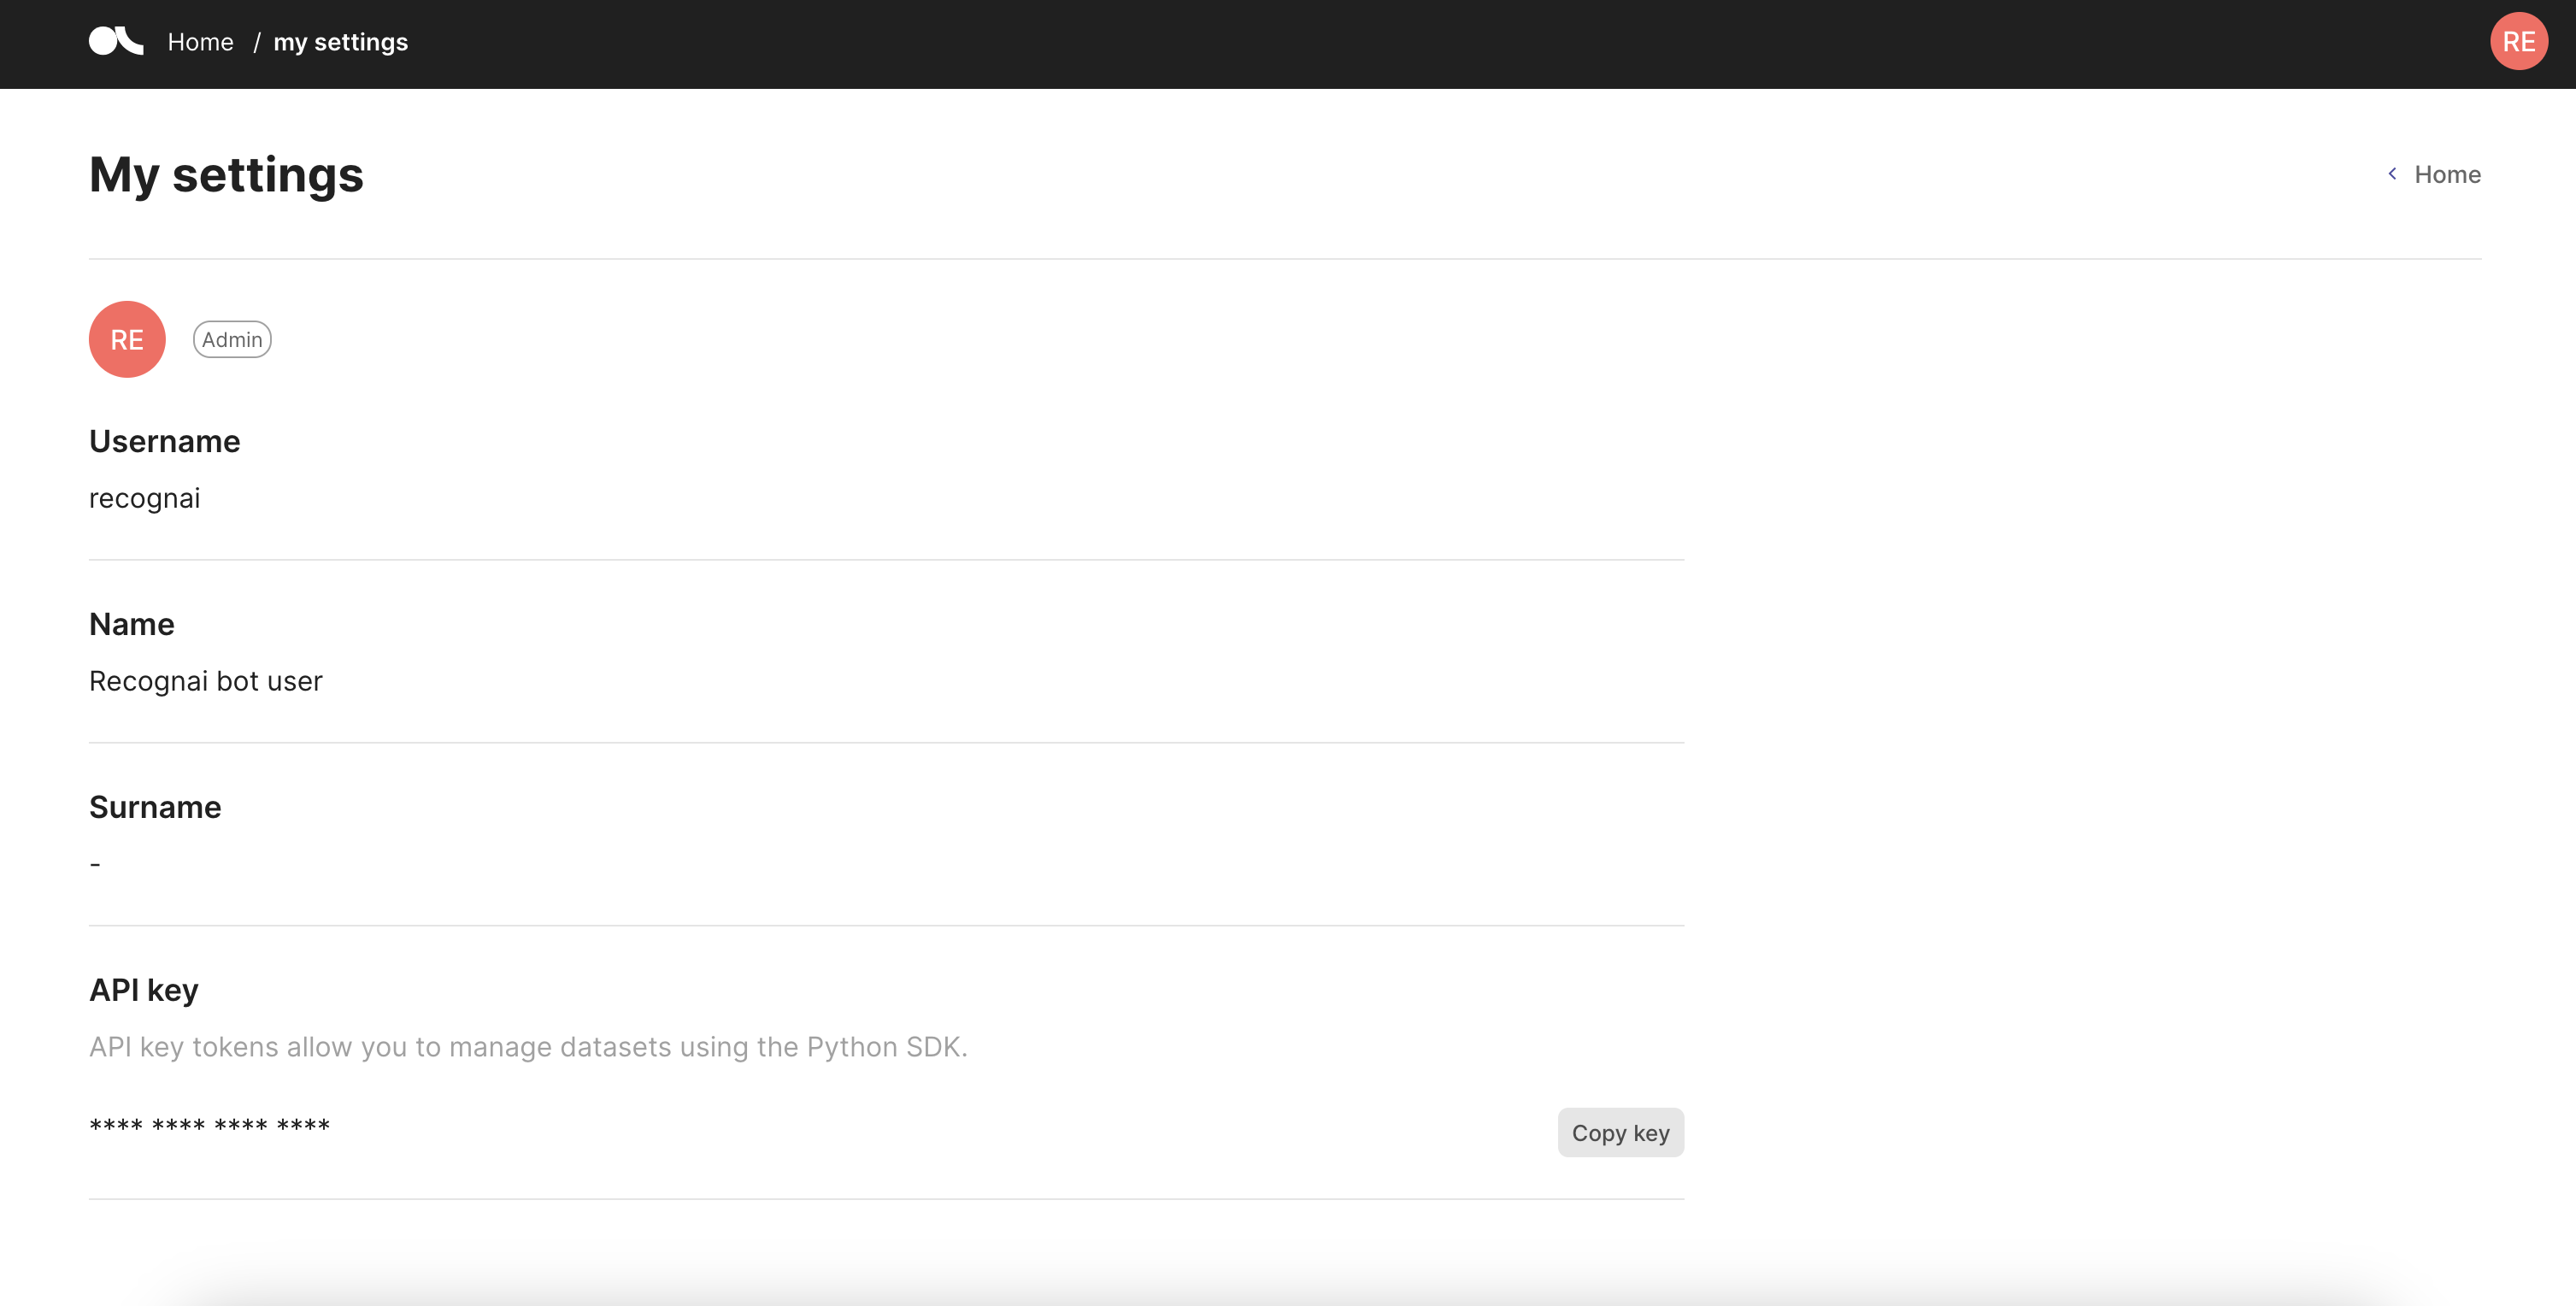
You can access this page by clicking on your user icon in the top right corner and selecting “My settings” in the dropdown.
In this page, you will be able to access your user settings and copy your API key. Learn more about how to set up users.
Role#
You can see your user role next to the user icon. The roles can be owner or annotator.
Username, name and surname#
These are your user details. The username shows the username used as login for the Argilla UI. The Name field corresponds to the first_name setting and the Surname field to the last_name setting.
API key#
Here you can copy your API key that you can use to connect to Argilla from the Python client.